29
/de/
de
AIzaSyAYiBZKx7MnpbEhh9jyipgxe19OcubqV5w
April 1, 2024
30897
Europe & Central Asia
ECS
false
2
1
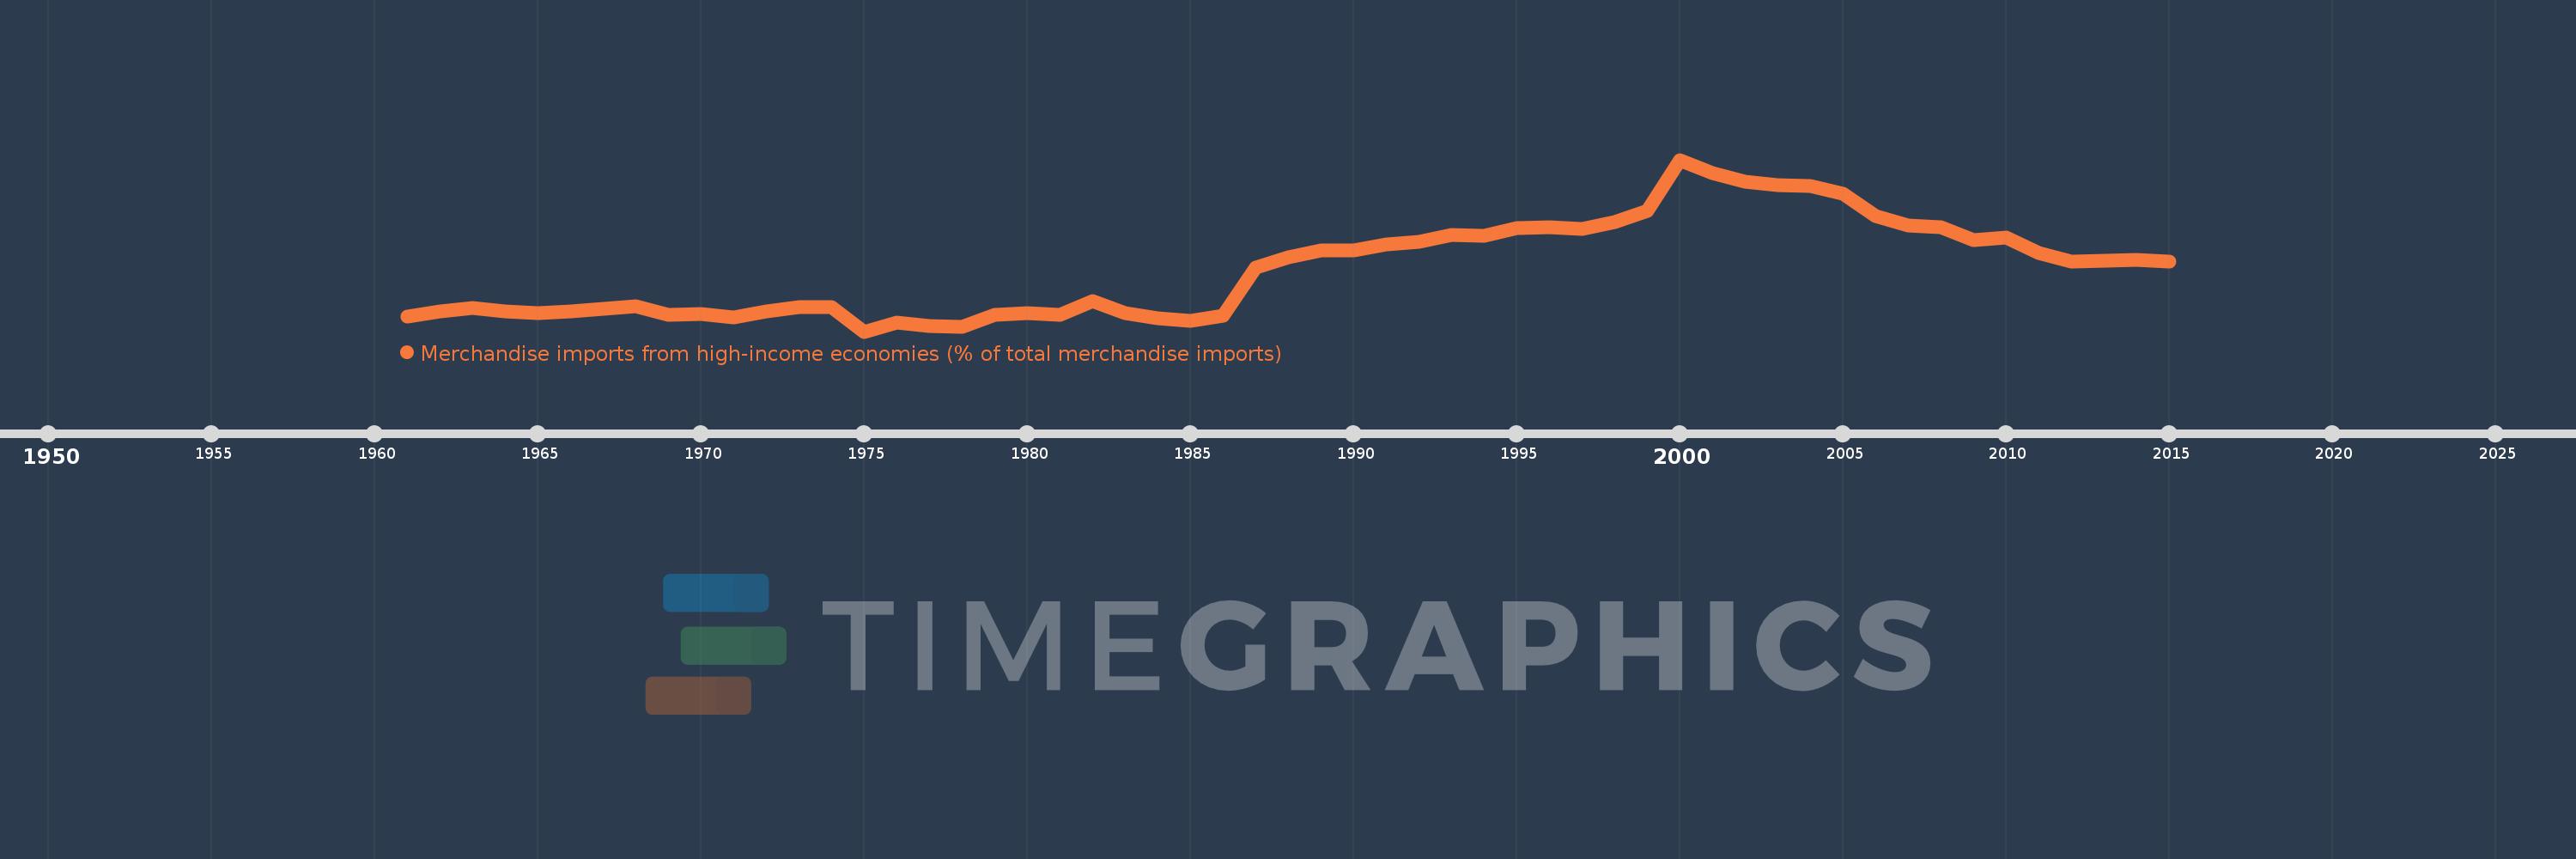
Merchandise imports from high-income economies (% of total merchandise imports)
2015,2014,2013,2012,2011,2010,2009,2008,2007,2006,2005,2004,2003,2002,2001,2000,1999,1998,1997,1996,1995,1994,1993,1992,1991,1990,1989,1988,1987,1986,1985,1984,1983,1982,1981,1980,1979,1978,1977,1976,1975,1974,1973,1972,1971,1970,1969,1968,1967,1966,1965,1964,1963,1962,1961
Diese Statistik in anderen Ländern:
AfghanistanAlbaniaAlgeriaAngolaAntigua and BarbudaArab WorldArgentinaArmeniaArubaAustraliaAustriaAzerbaijanBahamas, TheBahrainBangladeshBarbadosBelarusBelgiumBelizeBeninBermudaBoliviaBosnia and HerzegovinaBrazilBrunei DarussalamBulgariaBurkina FasoBurundiCabo VerdeCambodiaCameroonCanadaCaribbean small statesCentral African RepublicCentral Europe and the BalticsChadChileChinaColombiaComorosCongo, Dem. Rep.Congo, Rep.Costa RicaCote d'IvoireCroatiaCubaCyprusCzech RepublicDenmarkDjiboutiDominicaDominican RepublicEarly-demographic dividendEast Asia & PacificEast Asia & Pacific (excluding high income)East Asia & Pacific (IDA & IBRD countries)EcuadorEgypt, Arab Rep.El SalvadorEquatorial GuineaEstoniaEthiopiaEuro areaEurope & Central AsiaEurope & Central Asia (excluding high income)Europe & Central Asia (IDA & IBRD countries)European UnionFaroe IslandsFijiFinlandFragile and conflict affected situationsFranceFrench PolynesiaGabonGambia, TheGeorgiaGermanyGhanaGibraltarGreeceGreenlandGrenadaGuamGuatemalaGuineaGuinea-BissauGuyanaHaitiHeavily indebted poor countries (HIPC)High incomeHondurasHong Kong SAR, ChinaHungaryIBRD onlyIcelandIDA & IBRD totalIDA blendIDA onlyIDA totalIndiaIndonesiaIran, Islamic Rep.IraqIrelandIsraelItalyJamaicaJapanJordanKazakhstanKenyaKiribatiKorea, Dem. People’s Rep.Korea, Rep.KosovoKuwaitKyrgyz RepublicLao PDRLate-demographic dividendLatin America & Caribbean Latin America & Caribbean (excluding high income)Latin America & the Caribbean (IDA & IBRD countries)LatviaLeast developed countries: UN classificationLebanonLiberiaLibyaLithuaniaLow & middle incomeLow incomeLower middle incomeLuxembourgMacao SAR, ChinaMacedonia, FYRMadagascarMalawiMalaysiaMaldivesMaliMaltaMauritaniaMauritiusMexicoMiddle East & North AfricaMiddle East & North Africa (excluding high income)Middle East & North Africa (IDA & IBRD countries)Middle incomeMoldovaMongoliaMontenegroMoroccoMozambiqueMyanmarNauruNepalNetherlandsNew CaledoniaNew ZealandNicaraguaNigerNigeriaNorth AmericaNorwayOECD membersOmanOther small statesPacific island small statesPakistanPanamaPapua New GuineaParaguayPeruPhilippinesPolandPortugalPost-demographic dividendPre-demographic dividendQatarRomaniaRussian FederationRwandaSamoaSao Tome and PrincipeSaudi ArabiaSenegalSerbiaSeychellesSierra LeoneSingaporeSlovak RepublicSloveniaSmall statesSolomon IslandsSomaliaSouth AfricaSouth AsiaSouth Asia (IDA & IBRD)SpainSri LankaSt. Kitts and NevisSt. LuciaSt. Vincent and the GrenadinesSub-Saharan Africa Sub-Saharan Africa (excluding high income)Sub-Saharan Africa (IDA & IBRD countries)SudanSurinameSwedenSwitzerlandSyrian Arab RepublicTajikistanTanzaniaThailandTogoTongaTrinidad and TobagoTunisiaTurkeyTurkmenistanTuvaluUgandaUkraineUnited Arab EmiratesUnited KingdomUnited StatesUpper middle incomeUruguayUzbekistanVanuatuVenezuela, RBVietnamWorldYemen, Rep.ZambiaZimbabwe Zeitlinie:
Diese Zeitleiste vorliegt die Graphik ab 1961 J. bis 2015 J. Europe & Central Asia. Die Angaben bis 1960 J. sind nicht vorhanden. Die Zahl aktueller Beobachtungen nach Daten: 55.
Die Quelle (Bezeichnung):
Kennzahlen der Weltentwicklung
Die Quelle (Einrichtung):
World Bank staff estimates based data from International Monetary Fund's Direction of Trade database.
Kategorien:
Private Sector, Trade
Es wurde aktualisiert:
23 Apr 2017 Jahr
Kennzahlen der Wertänderungen vom Jahr zum Jahr
Minimum:
72.485
1 Jan 1975 Jahr
Maximum:
87.553
1 Jan 2000 Jahr
Zum Datum der Beobachtung
Wert
Absolute Veränderung
Die Veränderung bezüglich dem vorherigen Wert
1 Jan 1961 Jahr
73.782
+73.782
0.0%
1 Jan 1962 Jahr
74.249
+0.467
0.63%
1 Jan 1963 Jahr
74.581
+0.332
0.45%
1 Jan 1964 Jahr
74.243
-0.338
-0.45%
1 Jan 1965 Jahr
74.095
-0.149
-0.2%
1 Jan 1966 Jahr
74.246
+0.151
0.2%
1 Jan 1967 Jahr
74.458
+0.212
0.29%
1 Jan 1968 Jahr
74.74
+0.282
0.38%
1 Jan 1969 Jahr
73.97
-0.77
-1.03%
1 Jan 1970 Jahr
74.003
+0.033
0.04%
1 Jan 1971 Jahr
73.749
-0.254
-0.34%
1 Jan 1972 Jahr
74.247
+0.498
0.68%
1 Jan 1973 Jahr
74.642
+0.395
0.53%
1 Jan 1974 Jahr
74.627
-0.015
-0.02%
1 Jan 1975 Jahr
72.485
-2.142
-2.87%
1 Jan 1976 Jahr
73.249
+0.763
1.05%
1 Jan 1977 Jahr
72.966
-0.282
-0.39%
1 Jan 1978 Jahr
72.896
-0.071
-0.1%
1 Jan 1979 Jahr
73.972
+1.076
1.48%
1 Jan 1980 Jahr
74.079
+0.107
0.14%
1 Jan 1981 Jahr
73.951
-0.128
-0.17%
1 Jan 1982 Jahr
75.197
+1.247
1.69%
1 Jan 1983 Jahr
74.131
-1.066
-1.42%
1 Jan 1984 Jahr
73.647
-0.484
-0.65%
1 Jan 1985 Jahr
73.419
-0.228
-0.31%
1 Jan 1986 Jahr
73.865
+0.446
0.61%
1 Jan 1987 Jahr
78.112
+4.247
5.75%
1 Jan 1988 Jahr
79.018
+0.906
1.16%
1 Jan 1989 Jahr
79.583
+0.566
0.72%
1 Jan 1990 Jahr
79.574
-0.009
-0.01%
1 Jan 1991 Jahr
80.12
+0.546
0.69%
1 Jan 1992 Jahr
80.391
+0.271
0.34%
1 Jan 1993 Jahr
80.963
+0.572
0.71%
1 Jan 1994 Jahr
80.887
-0.076
-0.09%
1 Jan 1995 Jahr
81.528
+0.641
0.79%
1 Jan 1996 Jahr
81.614
+0.086
0.11%
1 Jan 1997 Jahr
81.46
-0.154
-0.19%
1 Jan 1998 Jahr
82.116
+0.657
0.81%
1 Jan 1999 Jahr
83.085
+0.969
1.18%
1 Jan 2000 Jahr
87.553
+4.467
5.38%
1 Jan 2001 Jahr
86.37
-1.183
-1.35%
1 Jan 2002 Jahr
85.666
-0.704
-0.81%
1 Jan 2003 Jahr
85.363
-0.303
-0.35%
1 Jan 2004 Jahr
85.239
-0.124
-0.14%
1 Jan 2005 Jahr
84.549
-0.69
-0.81%
1 Jan 2006 Jahr
82.609
-1.94
-2.3%
1 Jan 2007 Jahr
81.808
-0.801
-0.97%
1 Jan 2008 Jahr
81.652
-0.156
-0.19%
1 Jan 2009 Jahr
80.54
-1.112
-1.36%
1 Jan 2010 Jahr
80.738
+0.198
0.25%
1 Jan 2011 Jahr
79.387
-1.351
-1.67%
1 Jan 2012 Jahr
78.618
-0.769
-0.97%
1 Jan 2013 Jahr
78.675
+0.058
0.07%
1 Jan 2014 Jahr
78.771
+0.095
0.12%
1 Jan 2015 Jahr
78.617
-0.153
-0.19%
Bewertung der Länder gemäß mit laufender Statistik nach Jahren


Kommentare: