29
/de/
de
AIzaSyAYiBZKx7MnpbEhh9jyipgxe19OcubqV5w
April 1, 2024
204348
Myanmar
MMR
true
2
1
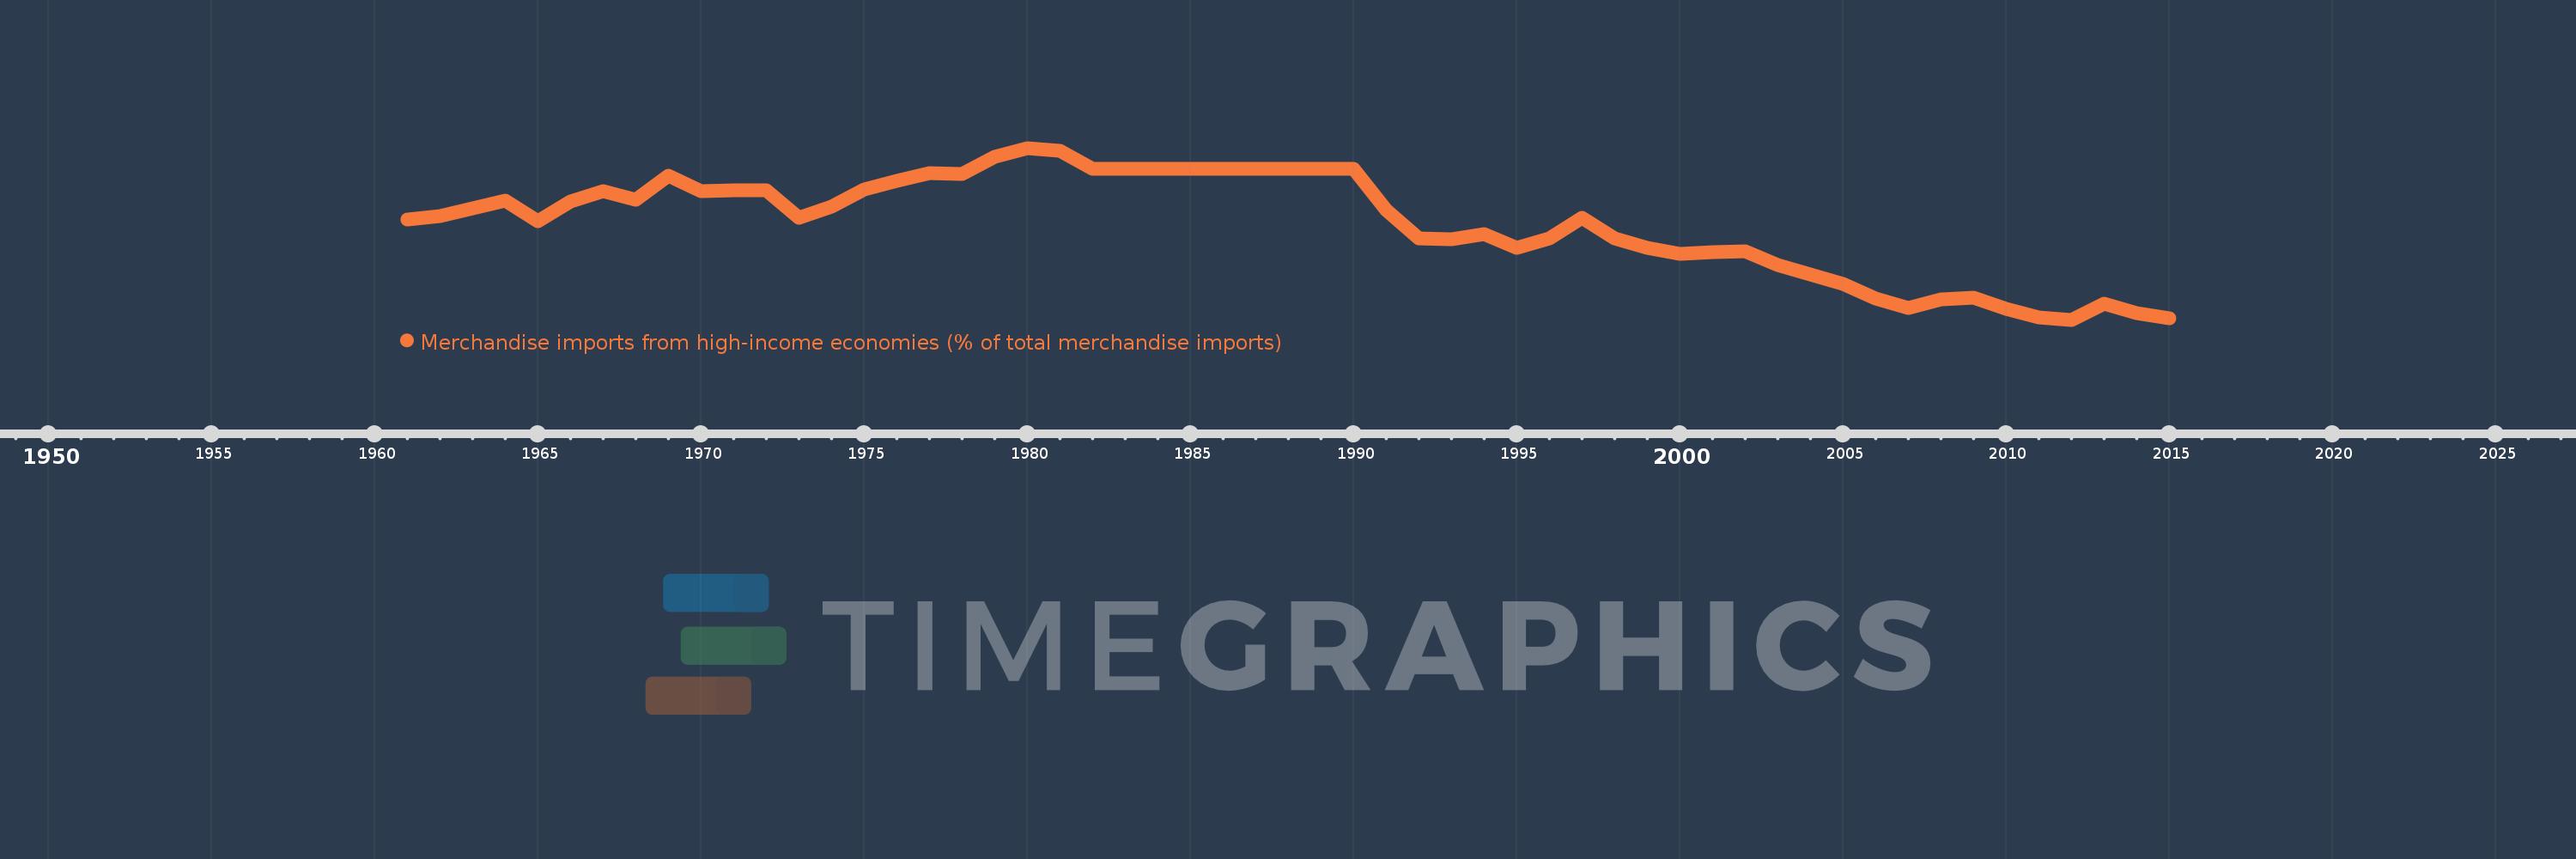
Merchandise imports from high-income economies (% of total merchandise imports)
2015,2014,2013,2012,2011,2010,2009,2008,2007,2006,2005,2004,2003,2002,2001,2000,1999,1998,1997,1996,1995,1994,1993,1992,1991,1990,1989,1988,1987,1986,1985,1984,1983,1982,1981,1980,1979,1978,1977,1976,1975,1974,1973,1972,1971,1970,1969,1968,1967,1966,1965,1964,1963,1962,1961
Diese Statistik in anderen Ländern:
AfghanistanAlbaniaAlgeriaAngolaAntigua and BarbudaArab WorldArgentinaArmeniaArubaAustraliaAustriaAzerbaijanBahamas, TheBahrainBangladeshBarbadosBelarusBelgiumBelizeBeninBermudaBoliviaBosnia and HerzegovinaBrazilBrunei DarussalamBulgariaBurkina FasoBurundiCabo VerdeCambodiaCameroonCanadaCaribbean small statesCentral African RepublicCentral Europe and the BalticsChadChileChinaColombiaComorosCongo, Dem. Rep.Congo, Rep.Costa RicaCote d'IvoireCroatiaCubaCyprusCzech RepublicDenmarkDjiboutiDominicaDominican RepublicEarly-demographic dividendEast Asia & PacificEast Asia & Pacific (excluding high income)East Asia & Pacific (IDA & IBRD countries)EcuadorEgypt, Arab Rep.El SalvadorEquatorial GuineaEstoniaEthiopiaEuro areaEurope & Central AsiaEurope & Central Asia (excluding high income)Europe & Central Asia (IDA & IBRD countries)European UnionFaroe IslandsFijiFinlandFragile and conflict affected situationsFranceFrench PolynesiaGabonGambia, TheGeorgiaGermanyGhanaGibraltarGreeceGreenlandGrenadaGuamGuatemalaGuineaGuinea-BissauGuyanaHaitiHeavily indebted poor countries (HIPC)High incomeHondurasHong Kong SAR, ChinaHungaryIBRD onlyIcelandIDA & IBRD totalIDA blendIDA onlyIDA totalIndiaIndonesiaIran, Islamic Rep.IraqIrelandIsraelItalyJamaicaJapanJordanKazakhstanKenyaKiribatiKorea, Dem. People’s Rep.Korea, Rep.KosovoKuwaitKyrgyz RepublicLao PDRLate-demographic dividendLatin America & Caribbean Latin America & Caribbean (excluding high income)Latin America & the Caribbean (IDA & IBRD countries)LatviaLeast developed countries: UN classificationLebanonLiberiaLibyaLithuaniaLow & middle incomeLow incomeLower middle incomeLuxembourgMacao SAR, ChinaMacedonia, FYRMadagascarMalawiMalaysiaMaldivesMaliMaltaMauritaniaMauritiusMexicoMiddle East & North AfricaMiddle East & North Africa (excluding high income)Middle East & North Africa (IDA & IBRD countries)Middle incomeMoldovaMongoliaMontenegroMoroccoMozambiqueMyanmarNauruNepalNetherlandsNew CaledoniaNew ZealandNicaraguaNigerNigeriaNorth AmericaNorwayOECD membersOmanOther small statesPacific island small statesPakistanPanamaPapua New GuineaParaguayPeruPhilippinesPolandPortugalPost-demographic dividendPre-demographic dividendQatarRomaniaRussian FederationRwandaSamoaSao Tome and PrincipeSaudi ArabiaSenegalSerbiaSeychellesSierra LeoneSingaporeSlovak RepublicSloveniaSmall statesSolomon IslandsSomaliaSouth AfricaSouth AsiaSouth Asia (IDA & IBRD)SpainSri LankaSt. Kitts and NevisSt. LuciaSt. Vincent and the GrenadinesSub-Saharan Africa Sub-Saharan Africa (excluding high income)Sub-Saharan Africa (IDA & IBRD countries)SudanSurinameSwedenSwitzerlandSyrian Arab RepublicTajikistanTanzaniaThailandTogoTongaTrinidad and TobagoTunisiaTurkeyTurkmenistanTuvaluUgandaUkraineUnited Arab EmiratesUnited KingdomUnited StatesUpper middle incomeUruguayUzbekistanVanuatuVenezuela, RBVietnamWorldYemen, Rep.ZambiaZimbabwe Zeitlinie:
Diese Zeitleiste vorliegt die Graphik ab 1961 J. bis 2015 J. Myanmar. Die Angaben bis 1960 J. sind nicht vorhanden. Die Zahl aktueller Beobachtungen nach Daten: 55.
Die Quelle (Bezeichnung):
Kennzahlen der Weltentwicklung
Die Quelle (Einrichtung):
World Bank staff estimates based data from International Monetary Fund's Direction of Trade database.
Kategorien:
Private Sector, Trade
Es wurde aktualisiert:
23 Apr 2017 Jahr
Kennzahlen der Wertänderungen vom Jahr zum Jahr
Minimum:
25.353
1 Jan 2012 Jahr
Maximum:
86.662
1 Jan 1980 Jahr
Zum Datum der Beobachtung
Wert
Absolute Veränderung
Die Veränderung bezüglich dem vorherigen Wert
1 Jan 1961 Jahr
61.111
+61.111
0.0%
1 Jan 1962 Jahr
62.482
+1.371
2.24%
1 Jan 1963 Jahr
65.153
+2.671
4.27%
1 Jan 1964 Jahr
67.75
+2.597
3.99%
1 Jan 1965 Jahr
60.37
-7.38
-10.89%
1 Jan 1966 Jahr
67.425
+7.054
11.69%
1 Jan 1967 Jahr
71.329
+3.905
5.79%
1 Jan 1968 Jahr
68.211
-3.119
-4.37%
1 Jan 1969 Jahr
76.821
+8.611
12.62%
1 Jan 1970 Jahr
71.162
-5.66
-7.37%
1 Jan 1971 Jahr
71.548
+0.386
0.54%
1 Jan 1972 Jahr
71.618
+0.07
0.1%
1 Jan 1973 Jahr
61.629
-9.989
-13.95%
1 Jan 1974 Jahr
65.826
+4.197
6.81%
1 Jan 1975 Jahr
71.728
+5.902
8.97%
1 Jan 1976 Jahr
74.919
+3.191
4.45%
1 Jan 1977 Jahr
77.628
+2.709
3.62%
1 Jan 1978 Jahr
77.306
-0.322
-0.41%
1 Jan 1979 Jahr
83.538
+6.231
8.06%
1 Jan 1980 Jahr
86.662
+3.124
3.74%
1 Jan 1981 Jahr
85.779
-0.882
-1.02%
1 Jan 1982 Jahr
79.291
-6.489
-7.56%
1 Jan 1983 Jahr
79.291
+0.0
0.0%
1 Jan 1984 Jahr
79.291
+0.0
0.0%
1 Jan 1985 Jahr
79.291
0.0
0.0%
1 Jan 1986 Jahr
79.291
+0.0
0.0%
1 Jan 1987 Jahr
79.291
0.0
0.0%
1 Jan 1988 Jahr
79.291
0.0
0.0%
1 Jan 1989 Jahr
79.291
+0.0
0.0%
1 Jan 1990 Jahr
79.291
0.0
0.0%
1 Jan 1991 Jahr
64.35
-14.941
-18.84%
1 Jan 1992 Jahr
54.321
-10.029
-15.59%
1 Jan 1993 Jahr
54.044
-0.277
-0.51%
1 Jan 1994 Jahr
56.014
+1.97
3.65%
1 Jan 1995 Jahr
50.973
-5.041
-9.0%
1 Jan 1996 Jahr
54.243
+3.27
6.42%
1 Jan 1997 Jahr
61.613
+7.37
13.59%
1 Jan 1998 Jahr
54.45
-7.163
-11.63%
1 Jan 1999 Jahr
50.888
-3.561
-6.54%
1 Jan 2000 Jahr
48.979
-1.91
-3.75%
1 Jan 2001 Jahr
49.4
+0.422
0.86%
1 Jan 2002 Jahr
49.659
+0.259
0.52%
1 Jan 2003 Jahr
44.848
-4.811
-9.69%
1 Jan 2004 Jahr
41.427
-3.421
-7.63%
1 Jan 2005 Jahr
38.129
-3.298
-7.96%
1 Jan 2006 Jahr
32.862
-5.267
-13.81%
1 Jan 2007 Jahr
29.597
-3.265
-9.94%
1 Jan 2008 Jahr
32.754
+3.157
10.67%
1 Jan 2009 Jahr
33.367
+0.613
1.87%
1 Jan 2010 Jahr
29.179
-4.188
-12.55%
1 Jan 2011 Jahr
26.056
-3.123
-10.7%
1 Jan 2012 Jahr
25.353
-0.703
-2.7%
1 Jan 2013 Jahr
30.938
+5.585
22.03%
1 Jan 2014 Jahr
27.6
-3.338
-10.79%
1 Jan 2015 Jahr
25.769
-1.831
-6.63%
Bewertung der Länder gemäß mit laufender Statistik nach Jahren


Kommentare: