29
/de/
de
AIzaSyAYiBZKx7MnpbEhh9jyipgxe19OcubqV5w
April 1, 2024
29076
East Asia & Pacific (IDA & IBRD countries)
TEA
false
2
1
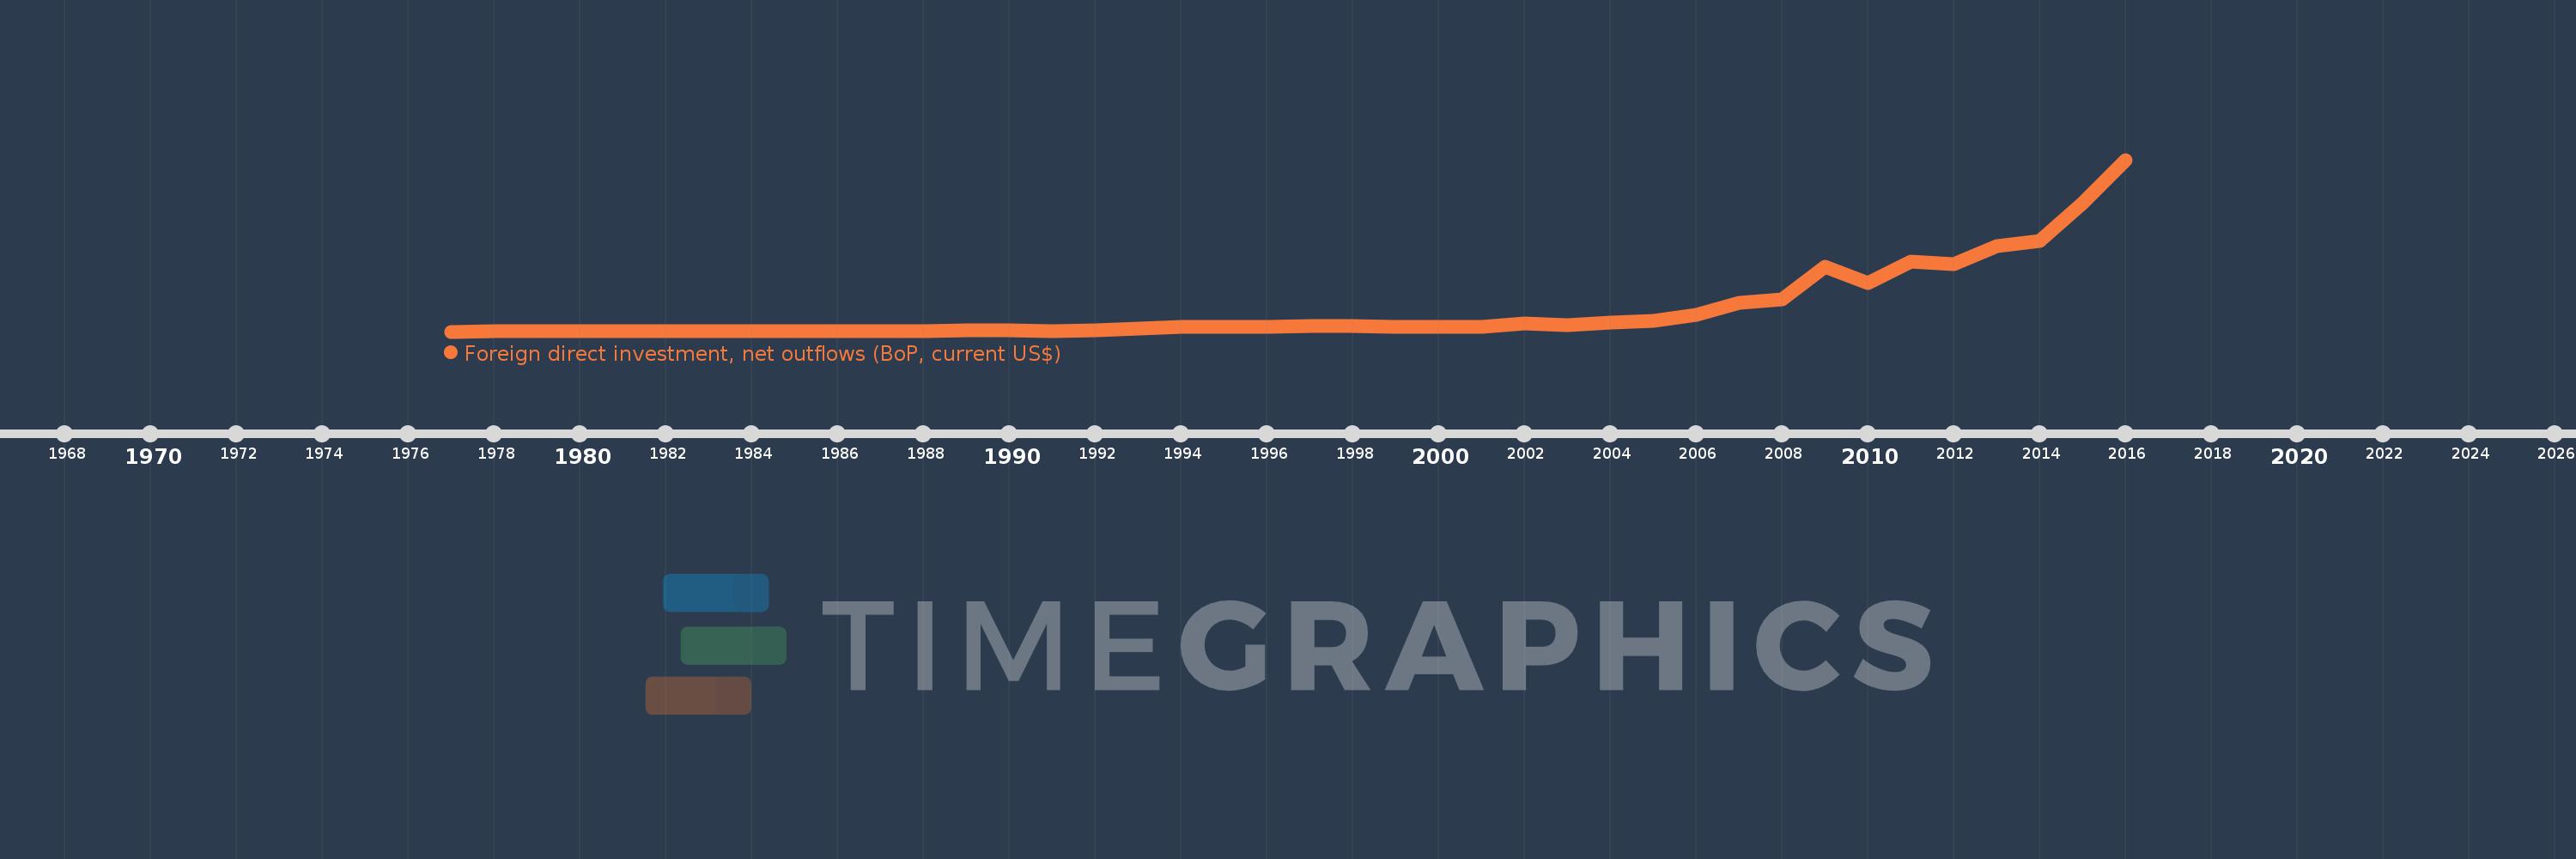
Foreign direct investment, net outflows (BoP, current US$)
2016,2015,2014,2013,2012,2011,2010,2009,2008,2007,2006,2005,2004,2003,2002,2001,2000,1999,1998,1997,1996,1995,1994,1993,1992,1991,1990,1989,1988,1987,1986,1985,1984,1983,1982,1981,1980,1979,1978,1977
Diese Statistik in anderen Ländern:
AfghanistanAlbaniaAlgeriaAngolaAntigua and BarbudaArab WorldArgentinaArmeniaArubaAustraliaAustriaAzerbaijanBahamas, TheBahrainBangladeshBarbadosBelarusBelgiumBelizeBeninBermudaBoliviaBosnia and HerzegovinaBotswanaBrazilBritish Virgin IslandsBrunei DarussalamBulgariaBurkina FasoBurundiCabo VerdeCambodiaCameroonCanadaCaribbean small statesCayman IslandsCentral African RepublicCentral Europe and the BalticsChadChileChinaColombiaComorosCongo, Dem. Rep.Congo, Rep.Costa RicaCote d'IvoireCroatiaCuracaoCyprusCzech RepublicDenmarkDominicaDominican RepublicEarly-demographic dividendEast Asia & PacificEast Asia & Pacific (excluding high income)East Asia & Pacific (IDA & IBRD countries)EcuadorEgypt, Arab Rep.El SalvadorEquatorial GuineaEritreaEstoniaEuro areaEurope & Central AsiaEurope & Central Asia (excluding high income)Europe & Central Asia (IDA & IBRD countries)European UnionFijiFinlandFragile and conflict affected situationsFranceFrench PolynesiaGabonGambia, TheGeorgiaGermanyGhanaGreeceGrenadaGuatemalaGuineaGuinea-BissauGuyanaHaitiHeavily indebted poor countries (HIPC)High incomeHondurasHong Kong SAR, ChinaHungaryIBRD onlyIcelandIDA & IBRD totalIDA blendIDA onlyIDA totalIndiaIndonesiaIran, Islamic Rep.IraqIrelandIsraelItalyJamaicaJapanJordanKazakhstanKenyaKiribatiKorea, Dem. People’s Rep.Korea, Rep.KosovoKuwaitKyrgyz RepublicLao PDRLate-demographic dividendLatin America & Caribbean Latin America & Caribbean (excluding high income)Latin America & the Caribbean (IDA & IBRD countries)LatviaLeast developed countries: UN classificationLebanonLesothoLiberiaLibyaLithuaniaLow & middle incomeLow incomeLower middle incomeLuxembourgMacao SAR, ChinaMacedonia, FYRMadagascarMalawiMalaysiaMaliMaltaMarshall IslandsMauritaniaMauritiusMexicoMicronesia, Fed. Sts.Middle East & North AfricaMiddle East & North Africa (excluding high income)Middle East & North Africa (IDA & IBRD countries)Middle incomeMoldovaMongoliaMontenegroMoroccoMozambiqueNamibiaNauruNetherlandsNew CaledoniaNew ZealandNicaraguaNigerNigeriaNorth AmericaNorthern Mariana IslandsNorwayOECD membersOmanOther small statesPacific island small statesPakistanPalauPanamaPapua New GuineaParaguayPeruPhilippinesPolandPortugalPost-demographic dividendPre-demographic dividendQatarRomaniaRussian FederationRwandaSamoaSao Tome and PrincipeSaudi ArabiaSenegalSerbiaSeychellesSierra LeoneSingaporeSint Maarten (Dutch part)Slovak RepublicSloveniaSmall statesSolomon IslandsSouth AfricaSouth AsiaSouth Asia (IDA & IBRD)SpainSri LankaSt. Kitts and NevisSt. LuciaSt. Vincent and the GrenadinesSub-Saharan Africa Sub-Saharan Africa (excluding high income)Sub-Saharan Africa (IDA & IBRD countries)SurinameSwazilandSwedenSwitzerlandSyrian Arab RepublicTajikistanTanzaniaThailandTimor-LesteTogoTongaTrinidad and TobagoTunisiaTurkeyUgandaUkraineUnited Arab EmiratesUnited KingdomUnited StatesUpper middle incomeUruguayVanuatuVenezuela, RBVietnamWest Bank and GazaWorldYemen, Rep.ZambiaZimbabwe Zeitlinie:
Diese Zeitleiste vorliegt die Graphik ab 1977 J. bis 2016 J. East Asia & Pacific (IDA & IBRD countries). Die Angaben bis 1976 J. sind nicht vorhanden. Die Zahl aktueller Beobachtungen nach Daten: 40.
Die Quelle (Bezeichnung):
Kennzahlen der Weltentwicklung
Die Quelle (Einrichtung):
International Monetary Fund, Balance of Payments database, supplemented by data from the United Nations Conference on Trade and Development and official national sources.
Kategorien:
Economy & Growth, Financial Sector
Es wurde aktualisiert:
23 Apr 2017 Jahr
Kennzahlen der Wertänderungen vom Jahr zum Jahr
im Durchschnitt:
28.356 Mlrd.
Minimum:
-1.884 Mln.
1 Jan 1977 Jahr
Maximum:
218.953 Mlrd.
1 Jan 2016 Jahr
Zum Datum der Beobachtung
Wert
Absolute Veränderung
Die Veränderung bezüglich dem vorherigen Wert
1 Jan 1977 Jahr
-1.884 Mln.
-1.884 Mln.
0.0%
1 Jan 1978 Jahr
2.773 Mln.
+4.657 Mln.
-247.15%
1 Jan 1979 Jahr
10.941 Mln.
+8.168 Mln.
294.56%
1 Jan 1980 Jahr
7.146 Mln.
-3.795 Mln.
-34.68%
1 Jan 1981 Jahr
307.626 Mln.
+300.48 Mln.
4.2 Tsnd.%
1 Jan 1982 Jahr
351.465 Mln.
+43.839 Mln.
14.25%
1 Jan 1983 Jahr
369.793 Mln.
+18.328 Mln.
5.21%
1 Jan 1984 Jahr
347.441 Mln.
-22.352 Mln.
-6.04%
1 Jan 1985 Jahr
394.851 Mln.
+47.411 Mln.
13.65%
1 Jan 1986 Jahr
912.352 Mln.
+517.501 Mln.
131.06%
1 Jan 1987 Jahr
701.07 Mln.
-211.283 Mln.
-23.16%
1 Jan 1988 Jahr
1.093 Mlrd.
+391.797 Mln.
55.89%
1 Jan 1989 Jahr
1.128 Mlrd.
+35.294 Mln.
3.23%
1 Jan 1990 Jahr
1.148 Mlrd.
+19.801 Mln.
1.76%
1 Jan 1991 Jahr
1.015 Mlrd.
-132.759 Mln.
-11.56%
1 Jan 1992 Jahr
1.238 Mlrd.
+222.818 Mln.
21.95%
1 Jan 1993 Jahr
4.328 Mlrd.
+3.09 Mlrd.
249.57%
1 Jan 1994 Jahr
6.361 Mlrd.
+2.033 Mlrd.
46.97%
1 Jan 1995 Jahr
5.639 Mlrd.
-721.525 Mln.
-11.34%
1 Jan 1996 Jahr
6.251 Mlrd.
+612.259 Mln.
10.86%
1 Jan 1997 Jahr
7.532 Mlrd.
+1.281 Mlrd.
20.49%
1 Jan 1998 Jahr
7.289 Mlrd.
-243.369 Mln.
-3.23%
1 Jan 1999 Jahr
5.552 Mlrd.
-1.737 Mlrd.
-23.83%
1 Jan 2000 Jahr
6.343 Mlrd.
+790.839 Mln.
14.24%
1 Jan 2001 Jahr
5.956 Mlrd.
-387.176 Mln.
-6.1%
1 Jan 2002 Jahr
10.831 Mlrd.
+4.875 Mlrd.
81.85%
1 Jan 2003 Jahr
8.639 Mlrd.
-2.192 Mlrd.
-20.24%
1 Jan 2004 Jahr
11.519 Mlrd.
+2.88 Mlrd.
33.34%
1 Jan 2005 Jahr
13.783 Mlrd.
+2.263 Mlrd.
19.65%
1 Jan 2006 Jahr
21.194 Mlrd.
+7.411 Mlrd.
53.77%
1 Jan 2007 Jahr
36.609 Mlrd.
+15.415 Mlrd.
72.73%
1 Jan 2008 Jahr
40.853 Mlrd.
+4.244 Mlrd.
11.59%
1 Jan 2009 Jahr
82.621 Mlrd.
+41.768 Mlrd.
102.24%
1 Jan 2010 Jahr
61.539 Mlrd.
-21.082 Mlrd.
-25.52%
1 Jan 2011 Jahr
89.306 Mlrd.
+27.768 Mlrd.
45.12%
1 Jan 2012 Jahr
86.184 Mlrd.
-3.122 Mlrd.
-3.5%
1 Jan 2013 Jahr
109.207 Mlrd.
+23.023 Mlrd.
26.71%
1 Jan 2014 Jahr
115.34 Mlrd.
+6.133 Mlrd.
5.62%
1 Jan 2015 Jahr
163.393 Mlrd.
+48.053 Mlrd.
41.66%
1 Jan 2016 Jahr
218.953 Mlrd.
+55.559 Mlrd.
34.0%
Bewertung der Länder gemäß mit laufender Statistik nach Jahren


Kommentare: