29
/de/
de
AIzaSyAYiBZKx7MnpbEhh9jyipgxe19OcubqV5w
April 1, 2024
24093
Arab World
ARB
false
2
1
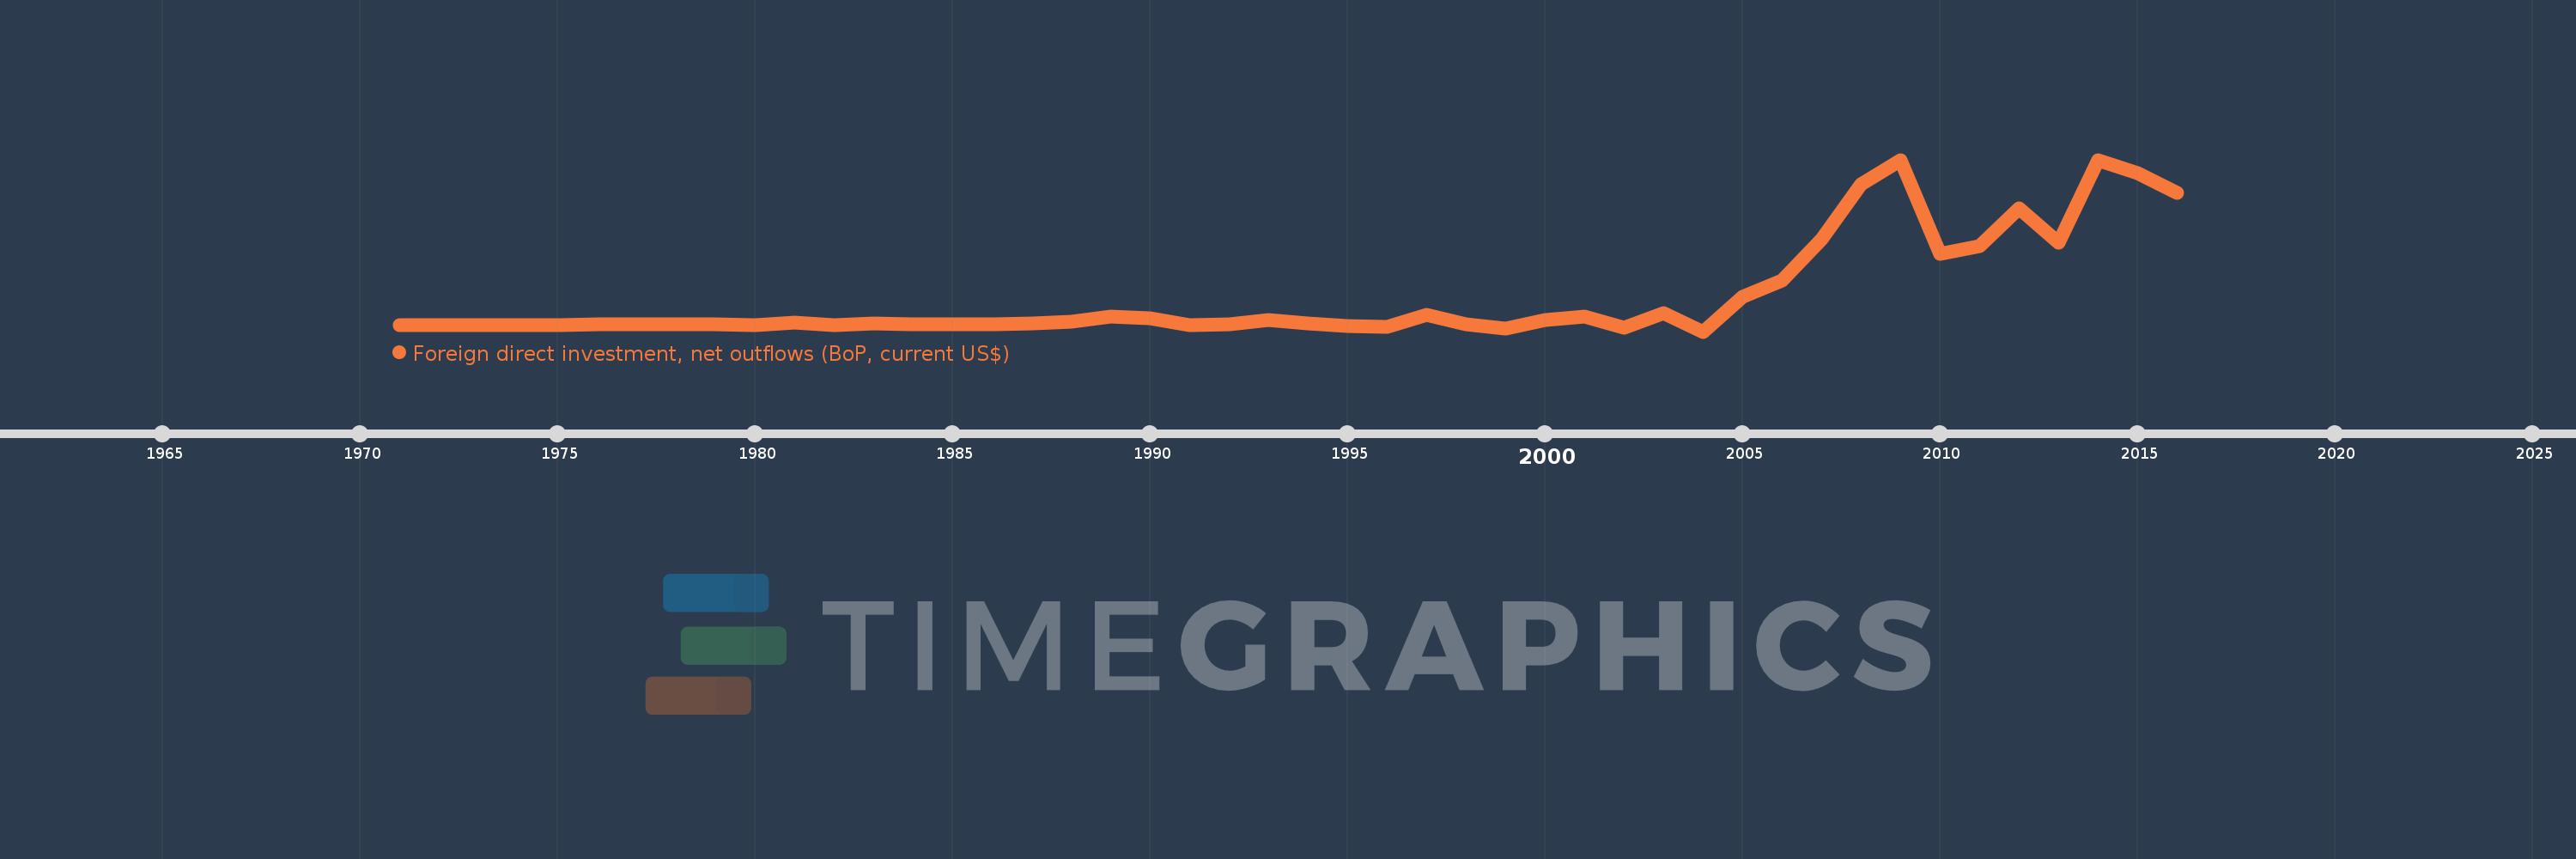
Foreign direct investment, net outflows (BoP, current US$)
2016,2015,2014,2013,2012,2011,2010,2009,2008,2007,2006,2005,2004,2003,2002,2001,2000,1999,1998,1997,1996,1995,1994,1993,1992,1991,1990,1989,1988,1987,1986,1985,1984,1983,1982,1981,1980,1979,1978,1977,1976,1975,1974,1973,1972,1971
Diese Statistik in anderen Ländern:
AfghanistanAlbaniaAlgeriaAngolaAntigua and BarbudaArab WorldArgentinaArmeniaArubaAustraliaAustriaAzerbaijanBahamas, TheBahrainBangladeshBarbadosBelarusBelgiumBelizeBeninBermudaBoliviaBosnia and HerzegovinaBotswanaBrazilBritish Virgin IslandsBrunei DarussalamBulgariaBurkina FasoBurundiCabo VerdeCambodiaCameroonCanadaCaribbean small statesCayman IslandsCentral African RepublicCentral Europe and the BalticsChadChileChinaColombiaComorosCongo, Dem. Rep.Congo, Rep.Costa RicaCote d'IvoireCroatiaCuracaoCyprusCzech RepublicDenmarkDominicaDominican RepublicEarly-demographic dividendEast Asia & PacificEast Asia & Pacific (excluding high income)East Asia & Pacific (IDA & IBRD countries)EcuadorEgypt, Arab Rep.El SalvadorEquatorial GuineaEritreaEstoniaEuro areaEurope & Central AsiaEurope & Central Asia (excluding high income)Europe & Central Asia (IDA & IBRD countries)European UnionFijiFinlandFragile and conflict affected situationsFranceFrench PolynesiaGabonGambia, TheGeorgiaGermanyGhanaGreeceGrenadaGuatemalaGuineaGuinea-BissauGuyanaHaitiHeavily indebted poor countries (HIPC)High incomeHondurasHong Kong SAR, ChinaHungaryIBRD onlyIcelandIDA & IBRD totalIDA blendIDA onlyIDA totalIndiaIndonesiaIran, Islamic Rep.IraqIrelandIsraelItalyJamaicaJapanJordanKazakhstanKenyaKiribatiKorea, Dem. People’s Rep.Korea, Rep.KosovoKuwaitKyrgyz RepublicLao PDRLate-demographic dividendLatin America & Caribbean Latin America & Caribbean (excluding high income)Latin America & the Caribbean (IDA & IBRD countries)LatviaLeast developed countries: UN classificationLebanonLesothoLiberiaLibyaLithuaniaLow & middle incomeLow incomeLower middle incomeLuxembourgMacao SAR, ChinaMacedonia, FYRMadagascarMalawiMalaysiaMaliMaltaMarshall IslandsMauritaniaMauritiusMexicoMicronesia, Fed. Sts.Middle East & North AfricaMiddle East & North Africa (excluding high income)Middle East & North Africa (IDA & IBRD countries)Middle incomeMoldovaMongoliaMontenegroMoroccoMozambiqueNamibiaNauruNetherlandsNew CaledoniaNew ZealandNicaraguaNigerNigeriaNorth AmericaNorthern Mariana IslandsNorwayOECD membersOmanOther small statesPacific island small statesPakistanPalauPanamaPapua New GuineaParaguayPeruPhilippinesPolandPortugalPost-demographic dividendPre-demographic dividendQatarRomaniaRussian FederationRwandaSamoaSao Tome and PrincipeSaudi ArabiaSenegalSerbiaSeychellesSierra LeoneSingaporeSint Maarten (Dutch part)Slovak RepublicSloveniaSmall statesSolomon IslandsSouth AfricaSouth AsiaSouth Asia (IDA & IBRD)SpainSri LankaSt. Kitts and NevisSt. LuciaSt. Vincent and the GrenadinesSub-Saharan Africa Sub-Saharan Africa (excluding high income)Sub-Saharan Africa (IDA & IBRD countries)SurinameSwazilandSwedenSwitzerlandSyrian Arab RepublicTajikistanTanzaniaThailandTimor-LesteTogoTongaTrinidad and TobagoTunisiaTurkeyUgandaUkraineUnited Arab EmiratesUnited KingdomUnited StatesUpper middle incomeUruguayVanuatuVenezuela, RBVietnamWest Bank and GazaWorldYemen, Rep.ZambiaZimbabwe Zeitlinie:
Diese Zeitleiste vorliegt die Graphik ab 1971 J. bis 2016 J. Arab World. Die Angaben bis 1970 J. sind nicht vorhanden. Die Zahl aktueller Beobachtungen nach Daten: 46.
Die Quelle (Bezeichnung):
Kennzahlen der Weltentwicklung
Die Quelle (Einrichtung):
International Monetary Fund, Balance of Payments database, supplemented by data from the United Nations Conference on Trade and Development and official national sources.
Kategorien:
Economy & Growth, Financial Sector
Es wurde aktualisiert:
23 Apr 2017 Jahr
Kennzahlen der Wertänderungen vom Jahr zum Jahr
im Durchschnitt:
7.633 Mlrd.
Minimum:
-1.782 Mlrd.
1 Jan 2004 Jahr
Maximum:
44.019 Mlrd.
1 Jan 2009 Jahr
Zum Datum der Beobachtung
Wert
Absolute Veränderung
Die Veränderung bezüglich dem vorherigen Wert
1 Jan 1971 Jahr
2.0 Mln.
+2.0 Mln.
0.0%
1 Jan 1972 Jahr
1000.0 Tsnd.
-1000.0 Tsnd.
-50.0%
1 Jan 1973 Jahr
6.68 Mln.
+5.68 Mln.
568.0%
1 Jan 1974 Jahr
8.48 Mln.
+1.8 Mln.
26.95%
1 Jan 1975 Jahr
2.42 Mln.
-6.06 Mln.
-71.46%
1 Jan 1976 Jahr
134.343 Mln.
+131.923 Mln.
5.45 Tsnd.%
1 Jan 1977 Jahr
116.154 Mln.
-18.189 Mln.
-13.54%
1 Jan 1978 Jahr
174.615 Mln.
+58.461 Mln.
50.33%
1 Jan 1979 Jahr
175.492 Mln.
+877.791 Tsnd.
0.5%
1 Jan 1980 Jahr
-114.843 Mln.
-290.335 Mln.
-165.44%
1 Jan 1981 Jahr
710.384 Mln.
+825.227 Mln.
-718.57%
1 Jan 1982 Jahr
-90.992 Mln.
-801.376 Mln.
-112.81%
1 Jan 1983 Jahr
433.184 Mln.
+524.176 Mln.
-576.07%
1 Jan 1984 Jahr
250.07 Mln.
-183.113 Mln.
-42.27%
1 Jan 1985 Jahr
240.054 Mln.
-10.017 Mln.
-4.01%
1 Jan 1986 Jahr
132.856 Mln.
-107.198 Mln.
-44.66%
1 Jan 1987 Jahr
361.381 Mln.
+228.525 Mln.
172.01%
1 Jan 1988 Jahr
954.919 Mln.
+593.538 Mln.
164.24%
1 Jan 1989 Jahr
2.221 Mlrd.
+1.266 Mlrd.
132.58%
1 Jan 1990 Jahr
1.824 Mlrd.
-396.649 Mln.
-17.86%
1 Jan 1991 Jahr
-63.77 Mln.
-1.888 Mlrd.
-103.5%
1 Jan 1992 Jahr
101.636 Mln.
+165.406 Mln.
-259.38%
1 Jan 1993 Jahr
1.388 Mlrd.
+1.286 Mlrd.
1.27 Tsnd.%
1 Jan 1994 Jahr
325.261 Mln.
-1.063 Mlrd.
-76.57%
1 Jan 1995 Jahr
-187.744 Mln.
-513.004 Mln.
-157.72%
1 Jan 1996 Jahr
-554.552 Mln.
-366.808 Mln.
195.38%
1 Jan 1997 Jahr
2.724 Mlrd.
+3.278 Mlrd.
-591.17%
1 Jan 1998 Jahr
212.915 Mln.
-2.511 Mlrd.
-92.18%
1 Jan 1999 Jahr
-913.04 Mln.
-1.126 Mlrd.
-528.83%
1 Jan 2000 Jahr
1.211 Mlrd.
+2.125 Mlrd.
-232.69%
1 Jan 2001 Jahr
2.32 Mlrd.
+1.109 Mlrd.
91.52%
1 Jan 2002 Jahr
-716.249 Mln.
-3.036 Mlrd.
-130.87%
1 Jan 2003 Jahr
3.11 Mlrd.
+3.827 Mlrd.
-534.25%
1 Jan 2004 Jahr
-1.782 Mlrd.
-4.893 Mlrd.
-157.3%
1 Jan 2005 Jahr
7.566 Mlrd.
+9.349 Mlrd.
-524.51%
1 Jan 2006 Jahr
11.729 Mlrd.
+4.163 Mlrd.
55.02%
1 Jan 2007 Jahr
22.8 Mlrd.
+11.071 Mlrd.
94.39%
1 Jan 2008 Jahr
37.386 Mlrd.
+14.586 Mlrd.
63.97%
1 Jan 2009 Jahr
44.019 Mlrd.
+6.633 Mlrd.
17.74%
1 Jan 2010 Jahr
18.929 Mlrd.
-25.089 Mlrd.
-57.0%
1 Jan 2011 Jahr
21.064 Mlrd.
+2.134 Mlrd.
11.28%
1 Jan 2012 Jahr
31.138 Mlrd.
+10.074 Mlrd.
47.83%
1 Jan 2013 Jahr
21.929 Mlrd.
-9.209 Mlrd.
-29.58%
1 Jan 2014 Jahr
43.996 Mlrd.
+22.067 Mlrd.
100.63%
1 Jan 2015 Jahr
40.58 Mlrd.
-3.415 Mlrd.
-7.76%
1 Jan 2016 Jahr
35.279 Mlrd.
-5.301 Mlrd.
-13.06%
Bewertung der Länder gemäß mit laufender Statistik nach Jahren


Kommentare: