29
/de/
de
AIzaSyAYiBZKx7MnpbEhh9jyipgxe19OcubqV5w
April 1, 2024
277118
United States
USA
true
2
1
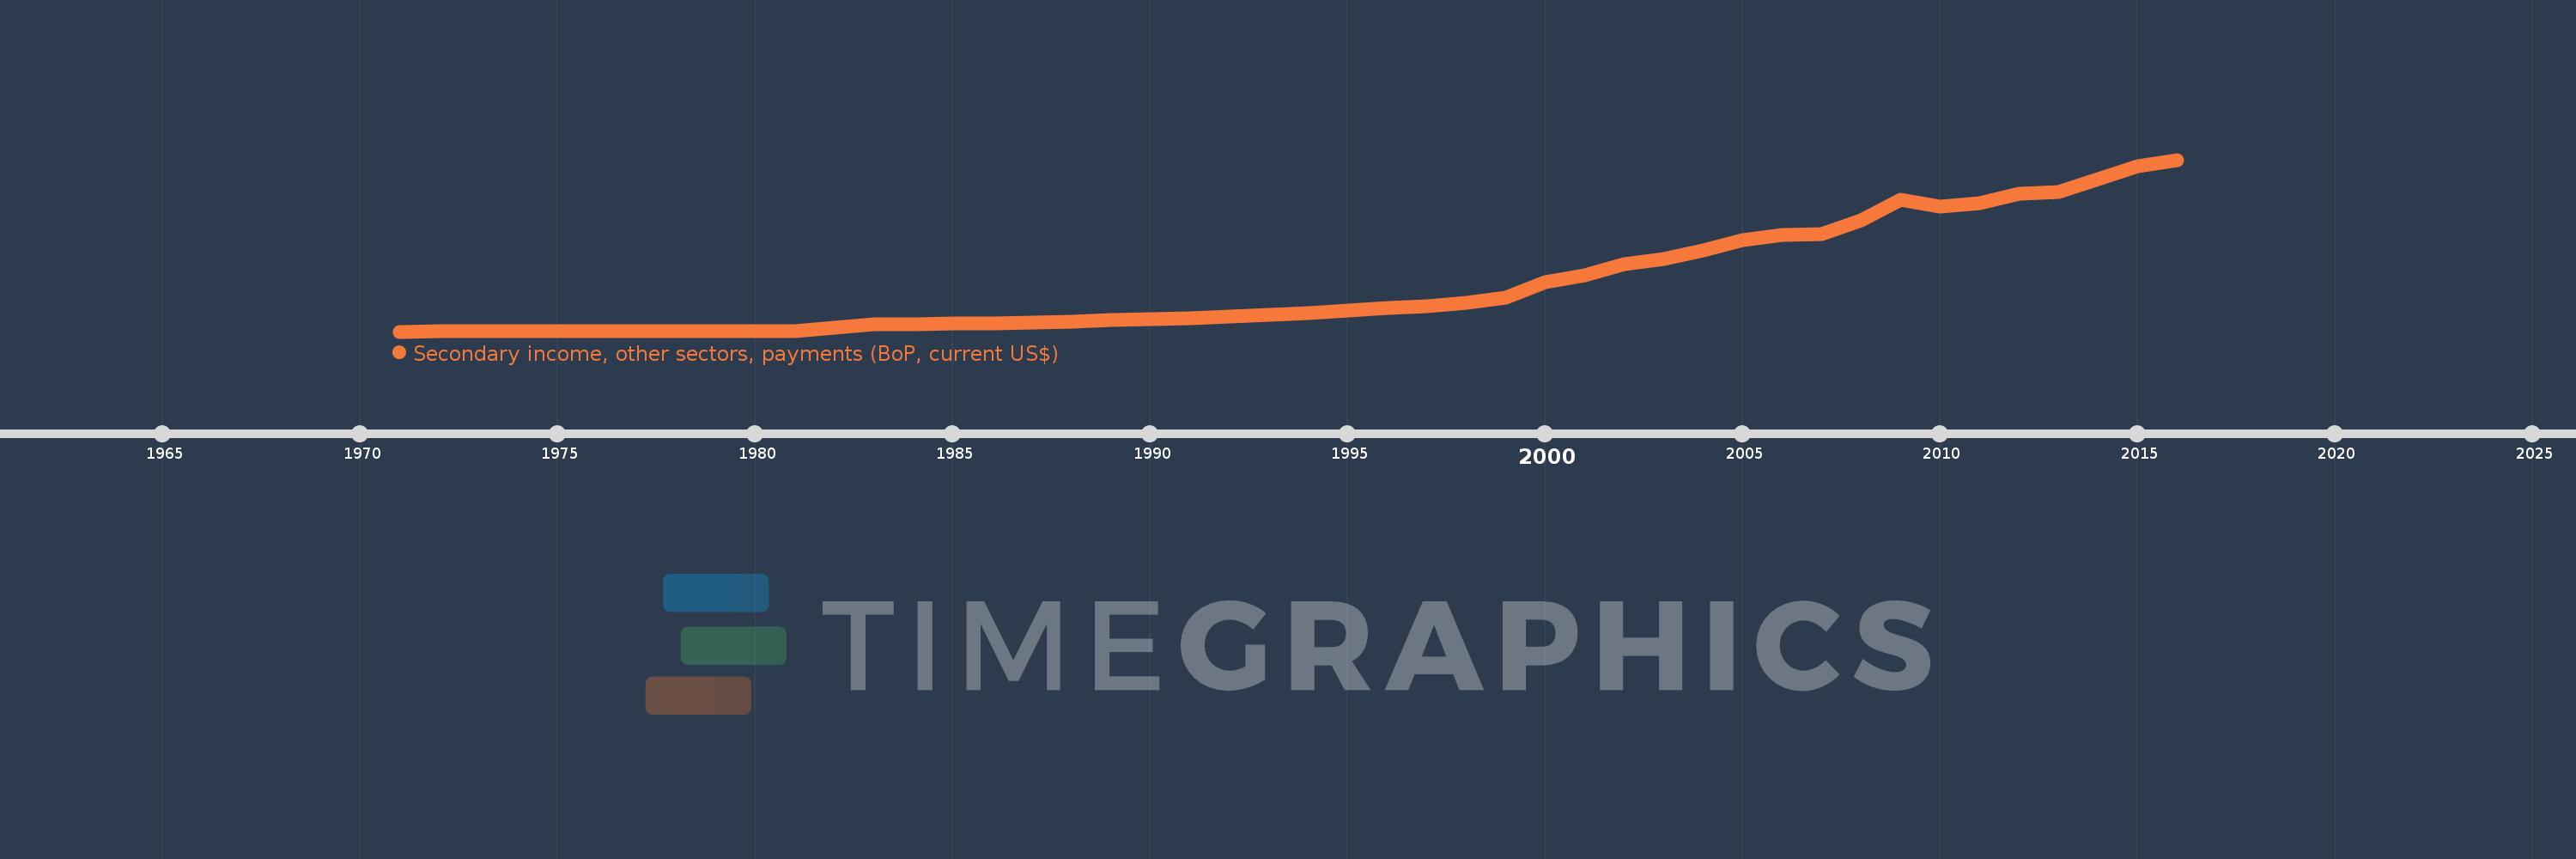
Secondary income, other sectors, payments (BoP, current US$)
2016,2015,2014,2013,2012,2011,2010,2009,2008,2007,2006,2005,2004,2003,2002,2001,2000,1999,1998,1997,1996,1995,1994,1993,1992,1991,1990,1989,1988,1987,1986,1985,1984,1983,1982,1981,1980,1979,1978,1977,1976,1975,1974,1973,1972,1971
Diese Statistik in anderen Ländern:
AfghanistanAlbaniaAlgeriaAngolaAntigua and BarbudaArab WorldArgentinaArmeniaArubaAustraliaAustriaAzerbaijanBahamas, TheBahrainBangladeshBarbadosBelarusBelgiumBelizeBeninBermudaBhutanBoliviaBosnia and HerzegovinaBotswanaBrazilBrunei DarussalamBulgariaBurkina FasoBurundiCabo VerdeCambodiaCameroonCanadaCaribbean small statesCentral African RepublicCentral Europe and the BalticsChadChileChinaColombiaComorosCongo, Dem. Rep.Congo, Rep.Costa RicaCote d'IvoireCroatiaCuracaoCyprusCzech RepublicDenmarkDjiboutiDominicaDominican RepublicEarly-demographic dividendEast Asia & PacificEast Asia & Pacific (excluding high income)East Asia & Pacific (IDA & IBRD countries)EcuadorEgypt, Arab Rep.El SalvadorEquatorial GuineaEritreaEstoniaEthiopiaEuro areaEurope & Central AsiaEurope & Central Asia (excluding high income)Europe & Central Asia (IDA & IBRD countries)European UnionFaroe IslandsFijiFinlandFragile and conflict affected situationsFranceFrench PolynesiaGabonGambia, TheGeorgiaGermanyGhanaGreeceGrenadaGuatemalaGuineaGuinea-BissauGuyanaHaitiHeavily indebted poor countries (HIPC)High incomeHondurasHong Kong SAR, ChinaHungaryIBRD onlyIcelandIDA & IBRD totalIDA blendIDA onlyIDA totalIndiaIndonesiaIran, Islamic Rep.IraqIrelandIsraelItalyJamaicaJapanJordanKazakhstanKenyaKiribatiKorea, Rep.KosovoKuwaitKyrgyz RepublicLao PDRLate-demographic dividendLatin America & Caribbean Latin America & Caribbean (excluding high income)Latin America & the Caribbean (IDA & IBRD countries)LatviaLeast developed countries: UN classificationLebanonLesothoLiberiaLibyaLithuaniaLow & middle incomeLow incomeLower middle incomeLuxembourgMacao SAR, ChinaMacedonia, FYRMadagascarMalawiMalaysiaMaldivesMaliMaltaMarshall IslandsMauritaniaMauritiusMexicoMicronesia, Fed. Sts.Middle East & North AfricaMiddle East & North Africa (excluding high income)Middle East & North Africa (IDA & IBRD countries)Middle incomeMoldovaMongoliaMontenegroMoroccoMozambiqueMyanmarNamibiaNepalNetherlandsNew CaledoniaNew ZealandNicaraguaNigerNigeriaNorth AmericaNorwayOECD membersOmanOther small statesPacific island small statesPakistanPalauPanamaPapua New GuineaParaguayPhilippinesPolandPortugalPost-demographic dividendPre-demographic dividendQatarRomaniaRussian FederationRwandaSamoaSao Tome and PrincipeSaudi ArabiaSenegalSerbiaSeychellesSierra LeoneSingaporeSint Maarten (Dutch part)Slovak RepublicSloveniaSmall statesSolomon IslandsSouth AfricaSouth AsiaSouth Asia (IDA & IBRD)South SudanSpainSri LankaSt. Kitts and NevisSt. LuciaSt. Vincent and the GrenadinesSub-Saharan Africa Sub-Saharan Africa (excluding high income)Sub-Saharan Africa (IDA & IBRD countries)SudanSurinameSwazilandSwedenSwitzerlandSyrian Arab RepublicTajikistanTanzaniaThailandTimor-LesteTogoTongaTrinidad and TobagoTunisiaTurkeyTuvaluUgandaUkraineUnited KingdomUnited StatesUpper middle incomeUruguayVanuatuVenezuela, RBVietnamWest Bank and GazaWorldYemen, Rep.ZambiaZimbabwe Zeitlinie:
Diese Zeitleiste vorliegt die Graphik ab 1971 J. bis 2016 J. United States. Die Angaben bis 1970 J. sind nicht vorhanden. Die Zahl aktueller Beobachtungen nach Daten: 46.
Die Quelle (Bezeichnung):
Kennzahlen der Weltentwicklung
Die Quelle (Einrichtung):
International Monetary Fund, Balance of Payments Statistics Yearbook and data files.
Kategorien:
Economy & Growth
Es wurde aktualisiert:
23 Apr 2017 Jahr
Kennzahlen der Wertänderungen vom Jahr zum Jahr
im Durchschnitt:
61.281 Mlrd.
Minimum:
1.48 Mlrd.
1 Jan 1971 Jahr
Maximum:
220.867 Mlrd.
1 Jan 2016 Jahr
Zum Datum der Beobachtung
Wert
Absolute Veränderung
Die Veränderung bezüglich dem vorherigen Wert
1 Jan 1971 Jahr
1.48 Mlrd.
+1.48 Mlrd.
0.0%
1 Jan 1972 Jahr
1.51 Mlrd.
+30.0 Mln.
2.03%
1 Jan 1973 Jahr
1.57 Mlrd.
+60.0 Mln.
3.97%
1 Jan 1974 Jahr
1.83 Mlrd.
+260.0 Mln.
16.56%
1 Jan 1975 Jahr
1.65 Mlrd.
-180.0 Mln.
-9.84%
1 Jan 1976 Jahr
1.64 Mlrd.
-10.0 Mln.
-0.61%
1 Jan 1977 Jahr
1.66 Mlrd.
+20.0 Mln.
1.22%
1 Jan 1978 Jahr
1.7 Mlrd.
+40.0 Mln.
2.41%
1 Jan 1979 Jahr
1.97 Mlrd.
+270.0 Mln.
15.88%
1 Jan 1980 Jahr
2.18 Mlrd.
+210.0 Mln.
10.66%
1 Jan 1981 Jahr
2.48 Mlrd.
+300.0 Mln.
13.76%
1 Jan 1982 Jahr
5.9 Mlrd.
+3.42 Mlrd.
137.9%
1 Jan 1983 Jahr
10.83 Mlrd.
+4.93 Mlrd.
83.56%
1 Jan 1984 Jahr
11.18 Mlrd.
+350.0 Mln.
3.23%
1 Jan 1985 Jahr
11.98 Mlrd.
+800.0 Mln.
7.16%
1 Jan 1986 Jahr
12.14 Mlrd.
+160.0 Mln.
1.34%
1 Jan 1987 Jahr
13.287 Mlrd.
+1.147 Mlrd.
9.45%
1 Jan 1988 Jahr
14.413 Mlrd.
+1.126 Mlrd.
8.47%
1 Jan 1989 Jahr
16.657 Mlrd.
+2.244 Mlrd.
15.57%
1 Jan 1990 Jahr
17.62 Mlrd.
+963.0 Mln.
5.78%
1 Jan 1991 Jahr
18.81 Mlrd.
+1.19 Mlrd.
6.75%
1 Jan 1992 Jahr
20.789 Mlrd.
+1.979 Mlrd.
10.52%
1 Jan 1993 Jahr
22.814 Mlrd.
+2.025 Mlrd.
9.74%
1 Jan 1994 Jahr
25.339 Mlrd.
+2.525 Mlrd.
11.07%
1 Jan 1995 Jahr
28.718 Mlrd.
+3.379 Mlrd.
13.33%
1 Jan 1996 Jahr
32.058 Mlrd.
+3.341 Mlrd.
11.63%
1 Jan 1997 Jahr
33.551 Mlrd.
+1.492 Mlrd.
4.66%
1 Jan 1998 Jahr
38.29 Mlrd.
+4.739 Mlrd.
14.13%
1 Jan 1999 Jahr
45.248 Mlrd.
+6.958 Mlrd.
18.17%
1 Jan 2000 Jahr
65.058 Mlrd.
+19.81 Mlrd.
43.78%
1 Jan 2001 Jahr
73.268 Mlrd.
+8.21 Mlrd.
12.62%
1 Jan 2002 Jahr
87.465 Mlrd.
+14.197 Mlrd.
19.38%
1 Jan 2003 Jahr
94.622 Mlrd.
+7.157 Mlrd.
8.18%
1 Jan 2004 Jahr
104.633 Mlrd.
+10.011 Mlrd.
10.58%
1 Jan 2005 Jahr
118.197 Mlrd.
+13.564 Mlrd.
12.96%
1 Jan 2006 Jahr
124.882 Mlrd.
+6.685 Mlrd.
5.66%
1 Jan 2007 Jahr
125.465 Mlrd.
+583.0 Mln.
0.47%
1 Jan 2008 Jahr
143.893 Mlrd.
+18.428 Mlrd.
14.69%
1 Jan 2009 Jahr
169.987 Mlrd.
+26.094 Mlrd.
18.13%
1 Jan 2010 Jahr
160.751 Mlrd.
-9.236 Mlrd.
-5.43%
1 Jan 2011 Jahr
164.925 Mlrd.
+4.174 Mlrd.
2.6%
1 Jan 2012 Jahr
177.207 Mlrd.
+12.282 Mlrd.
7.45%
1 Jan 2013 Jahr
179.457 Mlrd.
+2.25 Mlrd.
1.27%
1 Jan 2014 Jahr
195.907 Mlrd.
+16.45 Mlrd.
9.17%
1 Jan 2015 Jahr
213.051 Mlrd.
+17.144 Mlrd.
8.75%
1 Jan 2016 Jahr
220.867 Mlrd.
+7.816 Mlrd.
3.67%
Bewertung der Länder gemäß mit laufender Statistik nach Jahren


Kommentare: