29
/de/
de
AIzaSyAYiBZKx7MnpbEhh9jyipgxe19OcubqV5w
April 1, 2024
139756
Germany
DEU
true
2
1
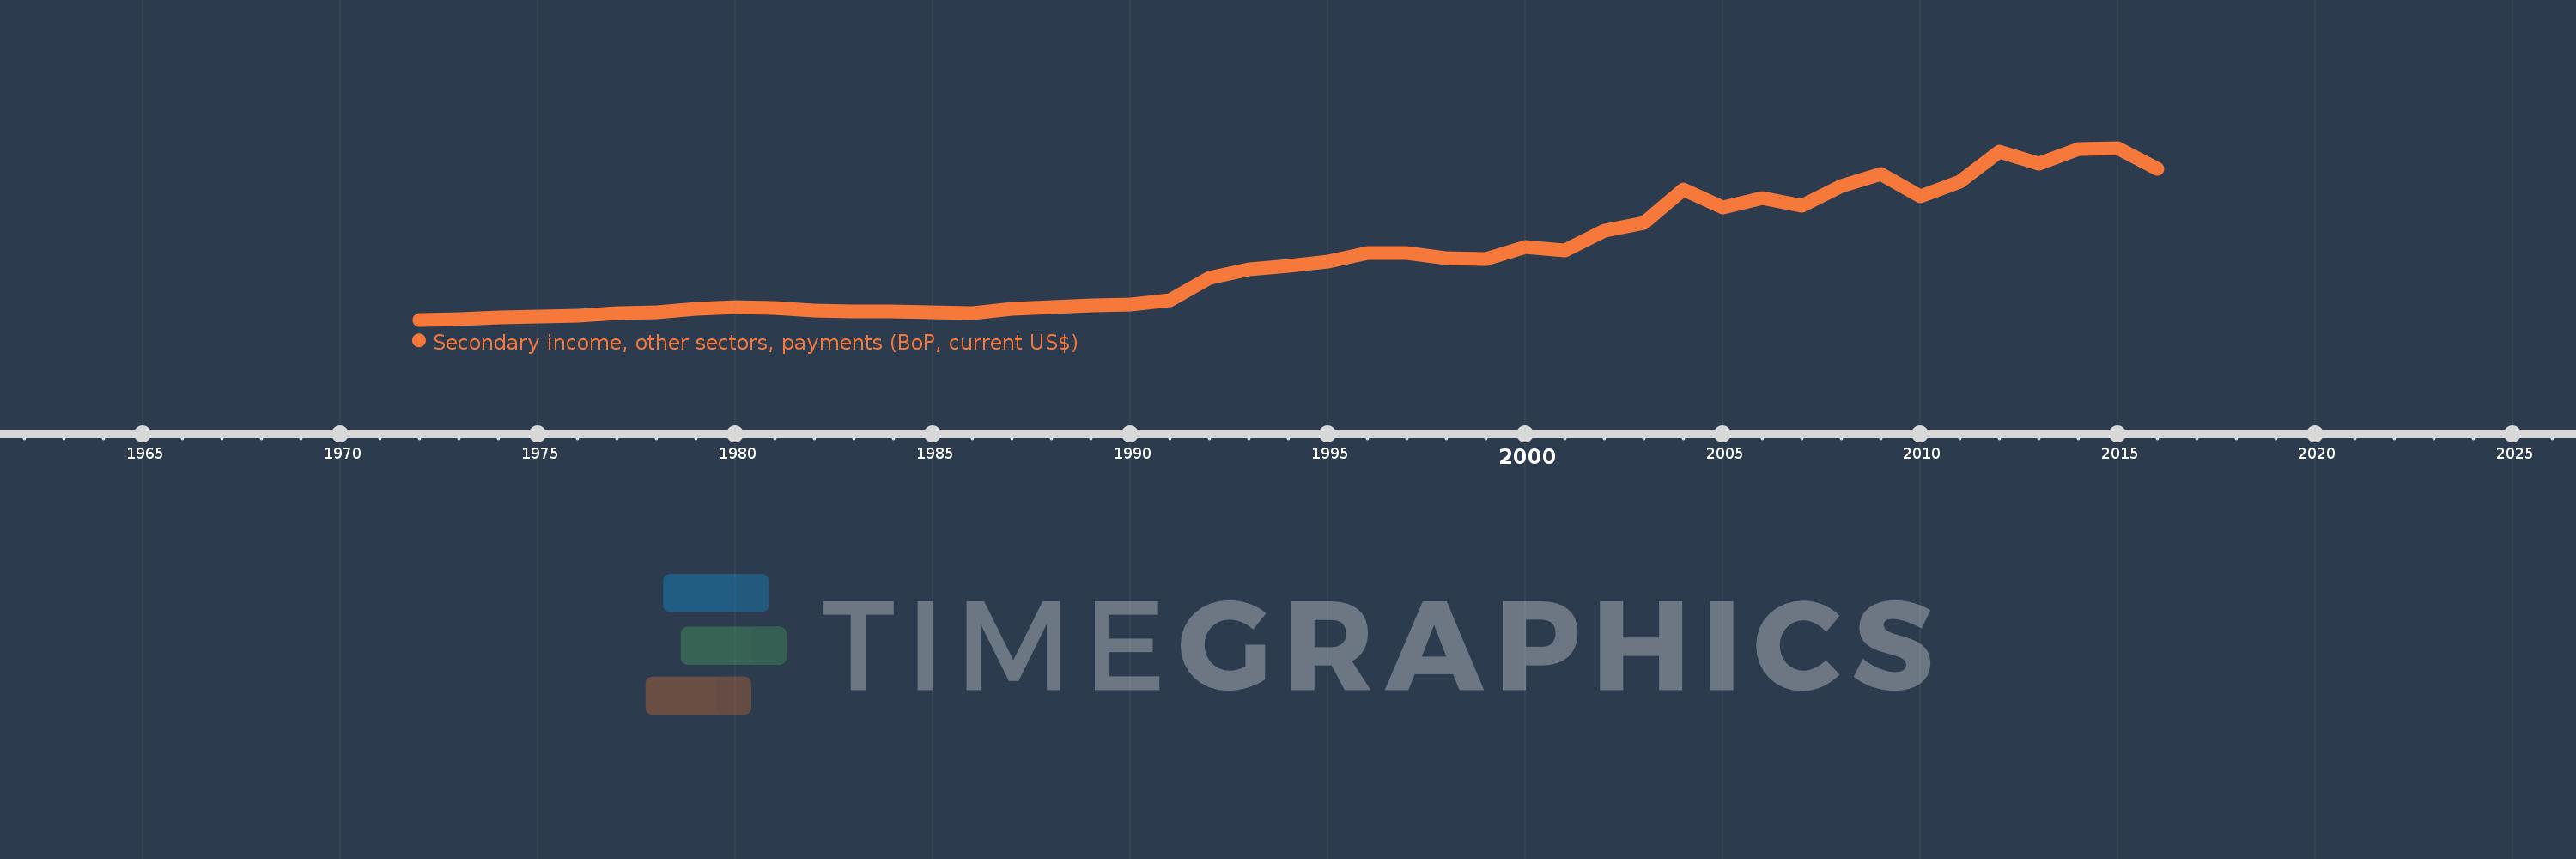
Secondary income, other sectors, payments (BoP, current US$)
2016,2015,2014,2013,2012,2011,2010,2009,2008,2007,2006,2005,2004,2003,2002,2001,2000,1999,1998,1997,1996,1995,1994,1993,1992,1991,1990,1989,1988,1987,1986,1985,1984,1983,1982,1981,1980,1979,1978,1977,1976,1975,1974,1973,1972
Diese Statistik in anderen Ländern:
AfghanistanAlbaniaAlgeriaAngolaAntigua and BarbudaArab WorldArgentinaArmeniaArubaAustraliaAustriaAzerbaijanBahamas, TheBahrainBangladeshBarbadosBelarusBelgiumBelizeBeninBermudaBhutanBoliviaBosnia and HerzegovinaBotswanaBrazilBrunei DarussalamBulgariaBurkina FasoBurundiCabo VerdeCambodiaCameroonCanadaCaribbean small statesCentral African RepublicCentral Europe and the BalticsChadChileChinaColombiaComorosCongo, Dem. Rep.Congo, Rep.Costa RicaCote d'IvoireCroatiaCuracaoCyprusCzech RepublicDenmarkDjiboutiDominicaDominican RepublicEarly-demographic dividendEast Asia & PacificEast Asia & Pacific (excluding high income)East Asia & Pacific (IDA & IBRD countries)EcuadorEgypt, Arab Rep.El SalvadorEquatorial GuineaEritreaEstoniaEthiopiaEuro areaEurope & Central AsiaEurope & Central Asia (excluding high income)Europe & Central Asia (IDA & IBRD countries)European UnionFaroe IslandsFijiFinlandFragile and conflict affected situationsFranceFrench PolynesiaGabonGambia, TheGeorgiaGermanyGhanaGreeceGrenadaGuatemalaGuineaGuinea-BissauGuyanaHaitiHeavily indebted poor countries (HIPC)High incomeHondurasHong Kong SAR, ChinaHungaryIBRD onlyIcelandIDA & IBRD totalIDA blendIDA onlyIDA totalIndiaIndonesiaIran, Islamic Rep.IraqIrelandIsraelItalyJamaicaJapanJordanKazakhstanKenyaKiribatiKorea, Rep.KosovoKuwaitKyrgyz RepublicLao PDRLate-demographic dividendLatin America & Caribbean Latin America & Caribbean (excluding high income)Latin America & the Caribbean (IDA & IBRD countries)LatviaLeast developed countries: UN classificationLebanonLesothoLiberiaLibyaLithuaniaLow & middle incomeLow incomeLower middle incomeLuxembourgMacao SAR, ChinaMacedonia, FYRMadagascarMalawiMalaysiaMaldivesMaliMaltaMarshall IslandsMauritaniaMauritiusMexicoMicronesia, Fed. Sts.Middle East & North AfricaMiddle East & North Africa (excluding high income)Middle East & North Africa (IDA & IBRD countries)Middle incomeMoldovaMongoliaMontenegroMoroccoMozambiqueMyanmarNamibiaNepalNetherlandsNew CaledoniaNew ZealandNicaraguaNigerNigeriaNorth AmericaNorwayOECD membersOmanOther small statesPacific island small statesPakistanPalauPanamaPapua New GuineaParaguayPhilippinesPolandPortugalPost-demographic dividendPre-demographic dividendQatarRomaniaRussian FederationRwandaSamoaSao Tome and PrincipeSaudi ArabiaSenegalSerbiaSeychellesSierra LeoneSingaporeSint Maarten (Dutch part)Slovak RepublicSloveniaSmall statesSolomon IslandsSouth AfricaSouth AsiaSouth Asia (IDA & IBRD)South SudanSpainSri LankaSt. Kitts and NevisSt. LuciaSt. Vincent and the GrenadinesSub-Saharan Africa Sub-Saharan Africa (excluding high income)Sub-Saharan Africa (IDA & IBRD countries)SudanSurinameSwazilandSwedenSwitzerlandSyrian Arab RepublicTajikistanTanzaniaThailandTimor-LesteTogoTongaTrinidad and TobagoTunisiaTurkeyTuvaluUgandaUkraineUnited KingdomUnited StatesUpper middle incomeUruguayVanuatuVenezuela, RBVietnamWest Bank and GazaWorldYemen, Rep.ZambiaZimbabwe Zeitlinie:
Diese Zeitleiste vorliegt die Graphik ab 1972 J. bis 2016 J. Germany. Die Angaben bis 1971 J. sind nicht vorhanden. Die Zahl aktueller Beobachtungen nach Daten: 45.
Die Quelle (Bezeichnung):
Kennzahlen der Weltentwicklung
Die Quelle (Einrichtung):
International Monetary Fund, Balance of Payments Statistics Yearbook and data files.
Kategorien:
Economy & Growth
Es wurde aktualisiert:
23 Apr 2017 Jahr
Kennzahlen der Wertänderungen vom Jahr zum Jahr
im Durchschnitt:
28.884 Mlrd.
Minimum:
2.072 Mlrd.
1 Jan 1972 Jahr
Maximum:
76.127 Mlrd.
1 Jan 2015 Jahr
Zum Datum der Beobachtung
Wert
Absolute Veränderung
Die Veränderung bezüglich dem vorherigen Wert
1 Jan 1972 Jahr
2.072 Mlrd.
+2.072 Mlrd.
0.0%
1 Jan 1973 Jahr
2.423 Mlrd.
+351.251 Mln.
16.95%
1 Jan 1974 Jahr
3.241 Mlrd.
+817.165 Mln.
33.72%
1 Jan 1975 Jahr
3.62 Mlrd.
+379.37 Mln.
11.71%
1 Jan 1976 Jahr
3.655 Mlrd.
+35.298 Mln.
0.98%
1 Jan 1977 Jahr
5.033 Mlrd.
+1.378 Mlrd.
37.71%
1 Jan 1978 Jahr
5.357 Mlrd.
+323.423 Mln.
6.43%
1 Jan 1979 Jahr
6.89 Mlrd.
+1.533 Mlrd.
28.63%
1 Jan 1980 Jahr
7.641 Mlrd.
+750.601 Mln.
10.89%
1 Jan 1981 Jahr
7.113 Mlrd.
-528.426 Mln.
-6.92%
1 Jan 1982 Jahr
5.924 Mlrd.
-1.188 Mlrd.
-16.7%
1 Jan 1983 Jahr
5.737 Mlrd.
-187.152 Mln.
-3.16%
1 Jan 1984 Jahr
5.516 Mlrd.
-221.747 Mln.
-3.87%
1 Jan 1985 Jahr
5.266 Mlrd.
-249.79 Mln.
-4.53%
1 Jan 1986 Jahr
5.059 Mlrd.
-207.039 Mln.
-3.93%
1 Jan 1987 Jahr
6.616 Mlrd.
+1.557 Mlrd.
30.78%
1 Jan 1988 Jahr
7.544 Mlrd.
+928.079 Mln.
14.03%
1 Jan 1989 Jahr
8.398 Mlrd.
+854.146 Mln.
11.32%
1 Jan 1990 Jahr
8.563 Mlrd.
+165.286 Mln.
1.97%
1 Jan 1991 Jahr
10.343 Mlrd.
+1.78 Mlrd.
20.78%
1 Jan 1992 Jahr
20.023 Mlrd.
+9.68 Mlrd.
93.59%
1 Jan 1993 Jahr
23.902 Mlrd.
+3.88 Mlrd.
19.38%
1 Jan 1994 Jahr
25.382 Mlrd.
+1.48 Mlrd.
6.19%
1 Jan 1995 Jahr
27.061 Mlrd.
+1.679 Mlrd.
6.62%
1 Jan 1996 Jahr
30.857 Mlrd.
+3.795 Mlrd.
14.03%
1 Jan 1997 Jahr
30.679 Mlrd.
-177.908 Mln.
-0.58%
1 Jan 1998 Jahr
28.586 Mlrd.
-2.093 Mlrd.
-6.82%
1 Jan 1999 Jahr
28.414 Mlrd.
-171.421 Mln.
-0.6%
1 Jan 2000 Jahr
33.41 Mlrd.
+4.996 Mlrd.
17.58%
1 Jan 2001 Jahr
32.101 Mlrd.
-1.309 Mlrd.
-3.92%
1 Jan 2002 Jahr
40.375 Mlrd.
+8.274 Mlrd.
25.78%
1 Jan 2003 Jahr
43.748 Mlrd.
+3.373 Mlrd.
8.35%
1 Jan 2004 Jahr
58.373 Mlrd.
+14.625 Mlrd.
33.43%
1 Jan 2005 Jahr
50.651 Mlrd.
-7.722 Mlrd.
-13.23%
1 Jan 2006 Jahr
54.459 Mlrd.
+3.808 Mlrd.
7.52%
1 Jan 2007 Jahr
51.045 Mlrd.
-3.414 Mlrd.
-6.27%
1 Jan 2008 Jahr
59.857 Mlrd.
+8.812 Mlrd.
17.26%
1 Jan 2009 Jahr
64.979 Mlrd.
+5.122 Mlrd.
8.56%
1 Jan 2010 Jahr
55.332 Mlrd.
-9.647 Mlrd.
-14.85%
1 Jan 2011 Jahr
61.693 Mlrd.
+6.361 Mlrd.
11.5%
1 Jan 2012 Jahr
74.359 Mlrd.
+12.665 Mlrd.
20.53%
1 Jan 2013 Jahr
69.506 Mlrd.
-4.853 Mlrd.
-6.53%
1 Jan 2014 Jahr
75.596 Mlrd.
+6.091 Mlrd.
8.76%
1 Jan 2015 Jahr
76.127 Mlrd.
+531.336 Mln.
0.7%
1 Jan 2016 Jahr
67.24 Mlrd.
-8.888 Mlrd.
-11.67%
Bewertung der Länder gemäß mit laufender Statistik nach Jahren


Kommentare: