29
/de/
de
AIzaSyAYiBZKx7MnpbEhh9jyipgxe19OcubqV5w
April 1, 2024
275941
United Kingdom
GBR
true
2
1
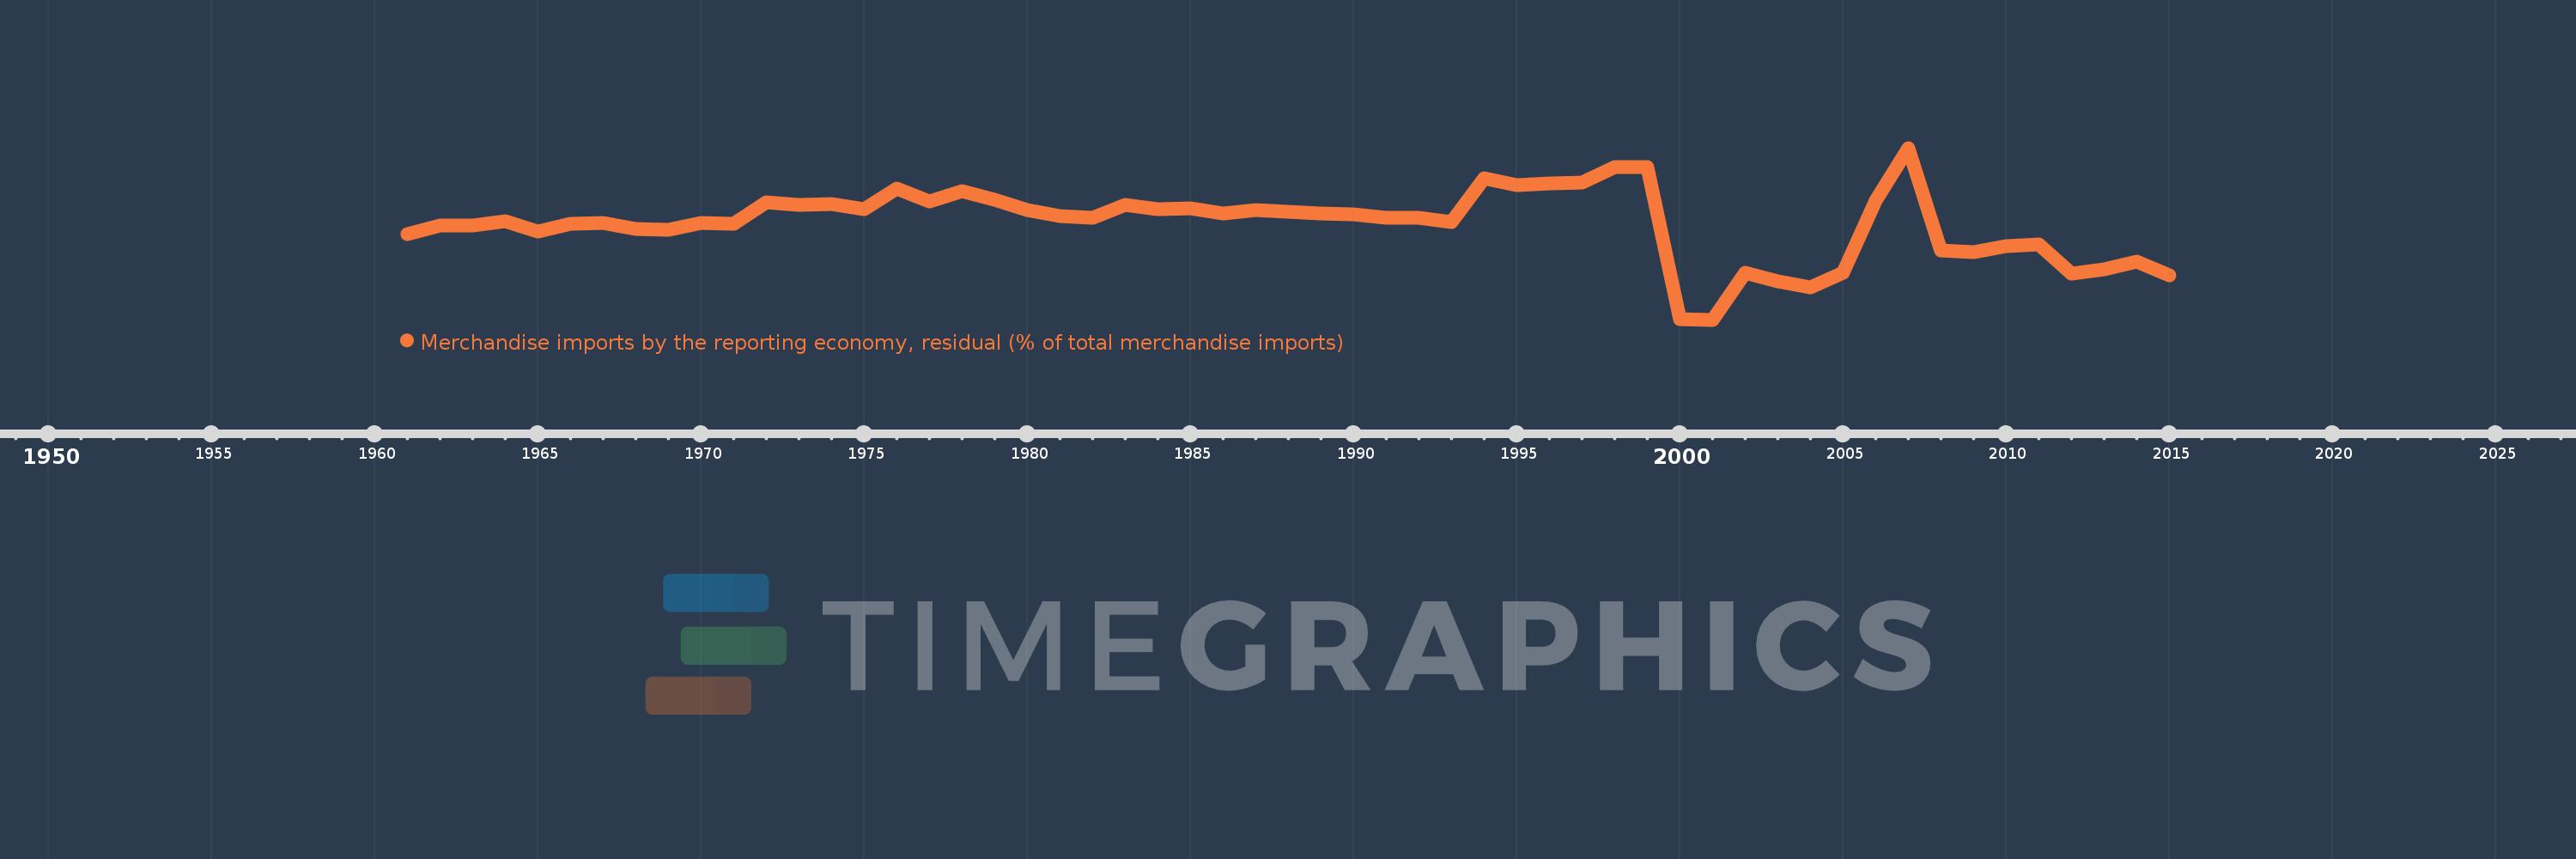
Merchandise imports by the reporting economy, residual (% of total merchandise imports)
2015,2014,2013,2012,2011,2010,2009,2008,2007,2006,2005,2004,2003,2002,2001,2000,1999,1998,1997,1996,1995,1994,1993,1992,1991,1990,1989,1988,1987,1986,1985,1984,1983,1982,1981,1980,1979,1978,1977,1976,1975,1974,1973,1972,1971,1970,1969,1968,1967,1966,1965,1964,1963,1962,1961
Diese Statistik in anderen Ländern:
AfghanistanAlbaniaAlgeriaAmerican SamoaAngolaAntigua and BarbudaArab WorldArgentinaArmeniaArubaAustraliaAustriaAzerbaijanBahamas, TheBahrainBangladeshBarbadosBelarusBelgiumBelizeBeninBermudaBoliviaBosnia and HerzegovinaBrazilBrunei DarussalamBulgariaBurkina FasoBurundiCabo VerdeCambodiaCameroonCanadaCaribbean small statesCentral African RepublicCentral Europe and the BalticsChadChileChinaColombiaComorosCongo, Dem. Rep.Congo, Rep.Costa RicaCote d'IvoireCroatiaCubaCyprusCzech RepublicDenmarkDjiboutiDominicaDominican RepublicEarly-demographic dividendEast Asia & PacificEast Asia & Pacific (excluding high income)East Asia & Pacific (IDA & IBRD countries)EcuadorEgypt, Arab Rep.El SalvadorEquatorial GuineaEstoniaEthiopiaEuro areaEurope & Central AsiaEurope & Central Asia (excluding high income)Europe & Central Asia (IDA & IBRD countries)European UnionFaroe IslandsFijiFinlandFragile and conflict affected situationsFranceFrench PolynesiaGabonGambia, TheGeorgiaGermanyGhanaGibraltarGreeceGreenlandGrenadaGuamGuatemalaGuineaGuinea-BissauGuyanaHaitiHeavily indebted poor countries (HIPC)High incomeHondurasHong Kong SAR, ChinaHungaryIBRD onlyIcelandIDA & IBRD totalIDA blendIDA onlyIDA totalIndiaIndonesiaIran, Islamic Rep.IraqIrelandIsraelItalyJamaicaJapanJordanKazakhstanKenyaKiribatiKorea, Dem. People’s Rep.Korea, Rep.KosovoKuwaitKyrgyz RepublicLao PDRLate-demographic dividendLatin America & Caribbean Latin America & Caribbean (excluding high income)Latin America & the Caribbean (IDA & IBRD countries)LatviaLeast developed countries: UN classificationLebanonLiberiaLibyaLithuaniaLow & middle incomeLow incomeLower middle incomeLuxembourgMacao SAR, ChinaMacedonia, FYRMadagascarMalawiMalaysiaMaldivesMaliMaltaMauritaniaMauritiusMexicoMiddle East & North AfricaMiddle East & North Africa (excluding high income)Middle East & North Africa (IDA & IBRD countries)Middle incomeMoldovaMongoliaMontenegroMoroccoMozambiqueMyanmarNauruNepalNetherlandsNew CaledoniaNew ZealandNicaraguaNigerNigeriaNorth AmericaNorwayOECD membersOmanOther small statesPacific island small statesPakistanPanamaPapua New GuineaParaguayPeruPhilippinesPolandPortugalPost-demographic dividendPre-demographic dividendQatarRomaniaRussian FederationRwandaSamoaSao Tome and PrincipeSaudi ArabiaSenegalSerbiaSeychellesSierra LeoneSingaporeSlovak RepublicSloveniaSmall statesSolomon IslandsSomaliaSouth AfricaSouth AsiaSouth Asia (IDA & IBRD)SpainSri LankaSt. Kitts and NevisSt. LuciaSt. Vincent and the GrenadinesSub-Saharan Africa Sub-Saharan Africa (excluding high income)Sub-Saharan Africa (IDA & IBRD countries)SudanSurinameSwedenSwitzerlandSyrian Arab RepublicTajikistanTanzaniaThailandTogoTongaTrinidad and TobagoTunisiaTurkeyTurkmenistanTuvaluUgandaUkraineUnited Arab EmiratesUnited KingdomUnited StatesUpper middle incomeUruguayUzbekistanVanuatuVenezuela, RBVietnamWorldYemen, Rep.ZambiaZimbabwe Zeitlinie:
Diese Zeitleiste vorliegt die Graphik ab 1961 J. bis 2015 J. United Kingdom. Die Angaben bis 1960 J. sind nicht vorhanden. Die Zahl aktueller Beobachtungen nach Daten: 55.
Die Quelle (Bezeichnung):
Kennzahlen der Weltentwicklung
Die Quelle (Einrichtung):
World Bank staff estimates based data from International Monetary Fund's Direction of Trade database.
Kategorien:
Private Sector, Trade
Es wurde aktualisiert:
23 Apr 2017 Jahr
Kennzahlen der Wertänderungen vom Jahr zum Jahr
Minimum:
0.3
1 Jan 2001 Jahr
Maximum:
10.347
1 Jan 2007 Jahr
Zum Datum der Beobachtung
Wert
Absolute Veränderung
Die Veränderung bezüglich dem vorherigen Wert
1 Jan 1961 Jahr
5.314
+5.314
0.0%
1 Jan 1962 Jahr
5.819
+0.505
9.5%
1 Jan 1963 Jahr
5.805
-0.014
-0.25%
1 Jan 1964 Jahr
6.064
+0.259
4.47%
1 Jan 1965 Jahr
5.44
-0.624
-10.29%
1 Jan 1966 Jahr
5.93
+0.49
9.0%
1 Jan 1967 Jahr
5.956
+0.026
0.45%
1 Jan 1968 Jahr
5.6
-0.356
-5.98%
1 Jan 1969 Jahr
5.547
-0.052
-0.94%
1 Jan 1970 Jahr
5.947
+0.399
7.19%
1 Jan 1971 Jahr
5.894
-0.053
-0.89%
1 Jan 1972 Jahr
7.161
+1.267
21.51%
1 Jan 1973 Jahr
7.02
-0.141
-1.97%
1 Jan 1974 Jahr
7.066
+0.046
0.66%
1 Jan 1975 Jahr
6.769
-0.297
-4.2%
1 Jan 1976 Jahr
7.974
+1.205
17.8%
1 Jan 1977 Jahr
7.205
-0.768
-9.64%
1 Jan 1978 Jahr
7.81
+0.604
8.39%
1 Jan 1979 Jahr
7.339
-0.47
-6.02%
1 Jan 1980 Jahr
6.727
-0.613
-8.35%
1 Jan 1981 Jahr
6.343
-0.383
-5.7%
1 Jan 1982 Jahr
6.258
-0.085
-1.34%
1 Jan 1983 Jahr
7.006
+0.748
11.95%
1 Jan 1984 Jahr
6.775
-0.231
-3.29%
1 Jan 1985 Jahr
6.81
+0.035
0.51%
1 Jan 1986 Jahr
6.524
-0.286
-4.2%
1 Jan 1987 Jahr
6.707
+0.183
2.8%
1 Jan 1988 Jahr
6.609
-0.098
-1.46%
1 Jan 1989 Jahr
6.498
-0.111
-1.68%
1 Jan 1990 Jahr
6.445
-0.053
-0.81%
1 Jan 1991 Jahr
6.284
-0.161
-2.5%
1 Jan 1992 Jahr
6.268
-0.016
-0.25%
1 Jan 1993 Jahr
5.995
-0.272
-4.35%
1 Jan 1994 Jahr
8.563
+2.568
42.83%
1 Jan 1995 Jahr
8.175
-0.388
-4.53%
1 Jan 1996 Jahr
8.281
+0.106
1.29%
1 Jan 1997 Jahr
8.311
+0.03
0.37%
1 Jan 1998 Jahr
9.238
+0.927
11.15%
1 Jan 1999 Jahr
9.234
-0.004
-0.04%
1 Jan 2000 Jahr
0.314
-8.92
-96.6%
1 Jan 2001 Jahr
0.3
-0.014
-4.59%
1 Jan 2002 Jahr
3.031
+2.731
911.22%
1 Jan 2003 Jahr
2.555
-0.476
-15.72%
1 Jan 2004 Jahr
2.215
-0.34
-13.31%
1 Jan 2005 Jahr
3.051
+0.837
37.78%
1 Jan 2006 Jahr
7.269
+4.218
138.25%
1 Jan 2007 Jahr
10.347
+3.078
42.34%
1 Jan 2008 Jahr
4.351
-5.996
-57.95%
1 Jan 2009 Jahr
4.273
-0.078
-1.79%
1 Jan 2010 Jahr
4.596
+0.322
7.54%
1 Jan 2011 Jahr
4.729
+0.134
2.91%
1 Jan 2012 Jahr
2.998
-1.732
-36.61%
1 Jan 2013 Jahr
3.247
+0.249
8.31%
1 Jan 2014 Jahr
3.702
+0.456
14.03%
1 Jan 2015 Jahr
2.888
-0.815
-22.0%
Bewertung der Länder gemäß mit laufender Statistik nach Jahren


Kommentare: