29
/de/
de
AIzaSyAYiBZKx7MnpbEhh9jyipgxe19OcubqV5w
April 1, 2024
171951
Kuwait
KWT
true
2
1
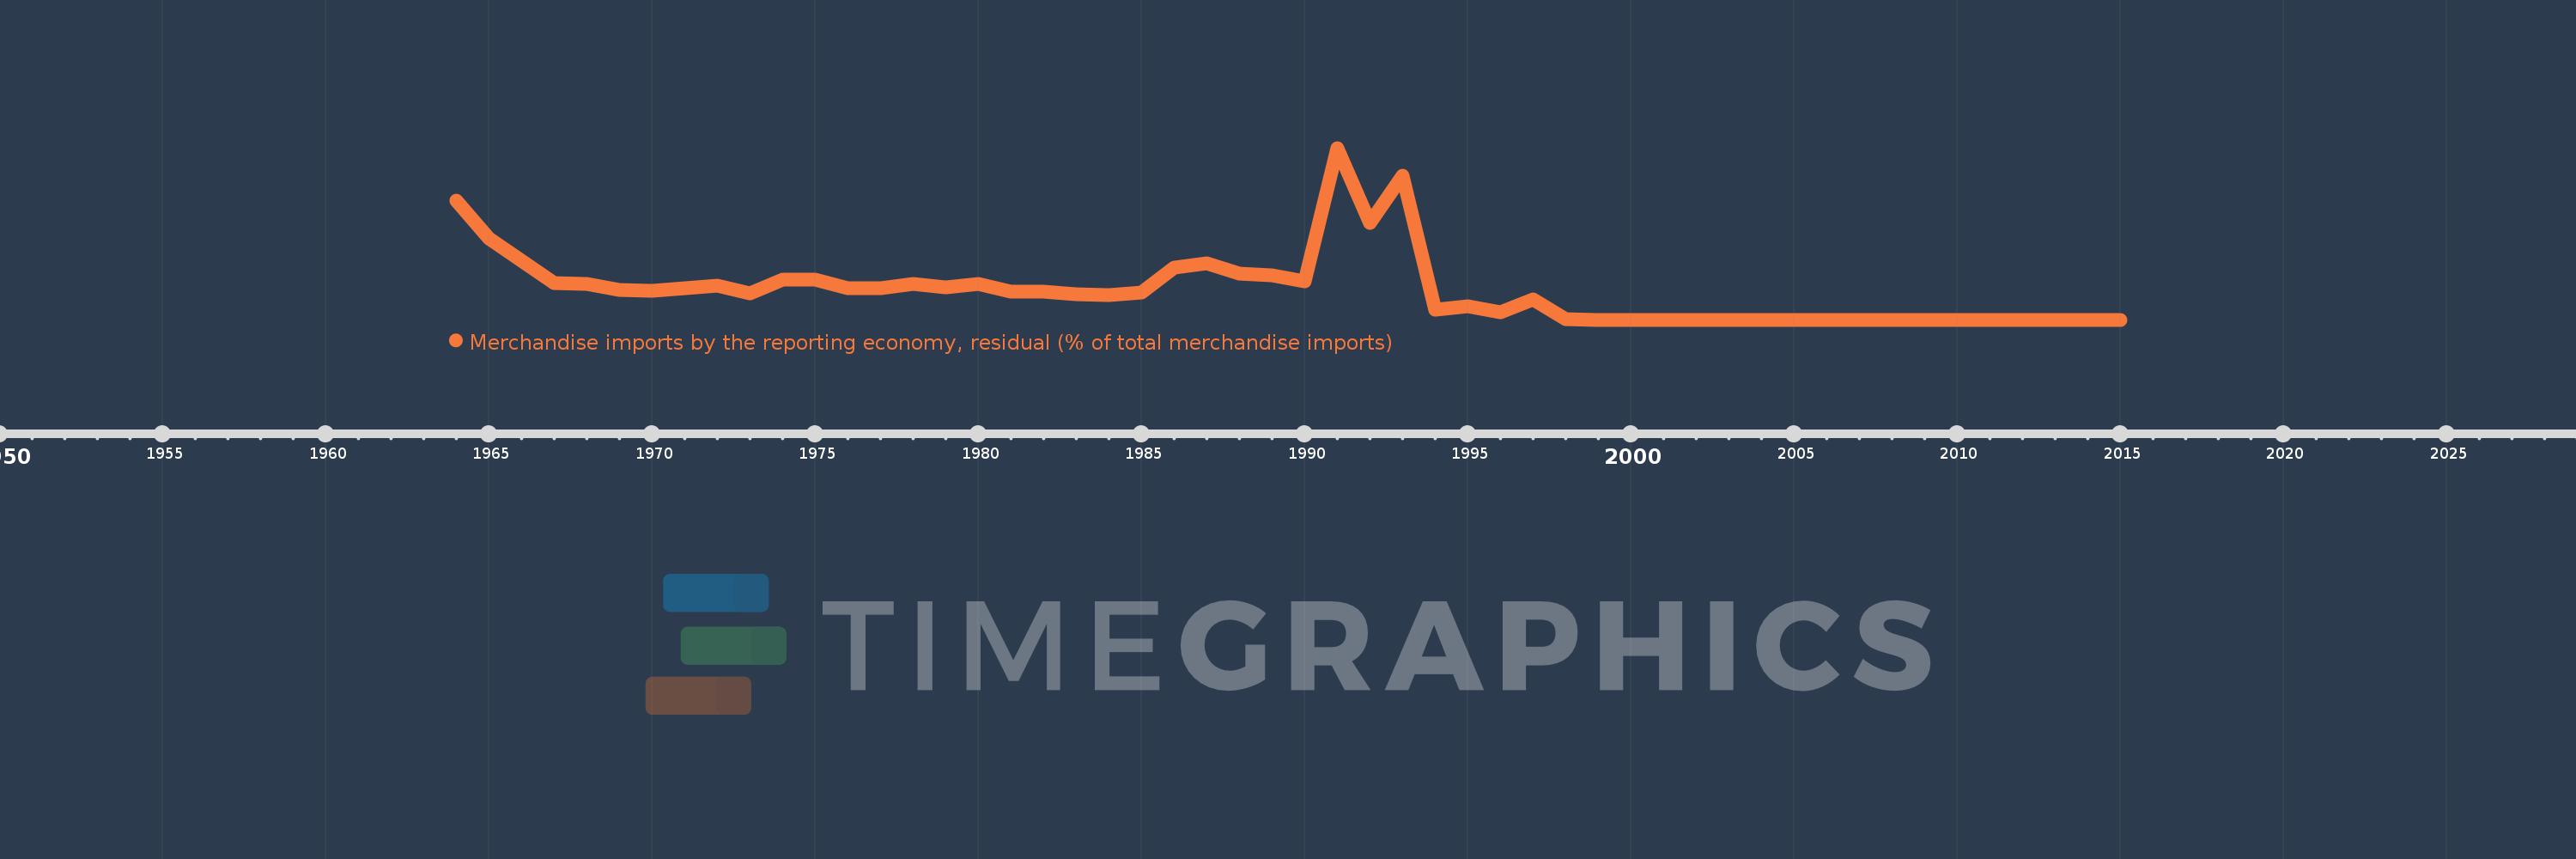
Merchandise imports by the reporting economy, residual (% of total merchandise imports)
2015,2014,2013,2012,2011,2010,2009,2008,2007,2006,2005,2004,2003,2002,2001,2000,1999,1998,1997,1996,1995,1994,1993,1992,1991,1990,1989,1988,1987,1986,1985,1984,1983,1982,1981,1980,1979,1978,1977,1976,1975,1974,1973,1972,1971,1970,1969,1968,1967,1965,1964
Diese Statistik in anderen Ländern:
AfghanistanAlbaniaAlgeriaAmerican SamoaAngolaAntigua and BarbudaArab WorldArgentinaArmeniaArubaAustraliaAustriaAzerbaijanBahamas, TheBahrainBangladeshBarbadosBelarusBelgiumBelizeBeninBermudaBoliviaBosnia and HerzegovinaBrazilBrunei DarussalamBulgariaBurkina FasoBurundiCabo VerdeCambodiaCameroonCanadaCaribbean small statesCentral African RepublicCentral Europe and the BalticsChadChileChinaColombiaComorosCongo, Dem. Rep.Congo, Rep.Costa RicaCote d'IvoireCroatiaCubaCyprusCzech RepublicDenmarkDjiboutiDominicaDominican RepublicEarly-demographic dividendEast Asia & PacificEast Asia & Pacific (excluding high income)East Asia & Pacific (IDA & IBRD countries)EcuadorEgypt, Arab Rep.El SalvadorEquatorial GuineaEstoniaEthiopiaEuro areaEurope & Central AsiaEurope & Central Asia (excluding high income)Europe & Central Asia (IDA & IBRD countries)European UnionFaroe IslandsFijiFinlandFragile and conflict affected situationsFranceFrench PolynesiaGabonGambia, TheGeorgiaGermanyGhanaGibraltarGreeceGreenlandGrenadaGuamGuatemalaGuineaGuinea-BissauGuyanaHaitiHeavily indebted poor countries (HIPC)High incomeHondurasHong Kong SAR, ChinaHungaryIBRD onlyIcelandIDA & IBRD totalIDA blendIDA onlyIDA totalIndiaIndonesiaIran, Islamic Rep.IraqIrelandIsraelItalyJamaicaJapanJordanKazakhstanKenyaKiribatiKorea, Dem. People’s Rep.Korea, Rep.KosovoKuwaitKyrgyz RepublicLao PDRLate-demographic dividendLatin America & Caribbean Latin America & Caribbean (excluding high income)Latin America & the Caribbean (IDA & IBRD countries)LatviaLeast developed countries: UN classificationLebanonLiberiaLibyaLithuaniaLow & middle incomeLow incomeLower middle incomeLuxembourgMacao SAR, ChinaMacedonia, FYRMadagascarMalawiMalaysiaMaldivesMaliMaltaMauritaniaMauritiusMexicoMiddle East & North AfricaMiddle East & North Africa (excluding high income)Middle East & North Africa (IDA & IBRD countries)Middle incomeMoldovaMongoliaMontenegroMoroccoMozambiqueMyanmarNauruNepalNetherlandsNew CaledoniaNew ZealandNicaraguaNigerNigeriaNorth AmericaNorwayOECD membersOmanOther small statesPacific island small statesPakistanPanamaPapua New GuineaParaguayPeruPhilippinesPolandPortugalPost-demographic dividendPre-demographic dividendQatarRomaniaRussian FederationRwandaSamoaSao Tome and PrincipeSaudi ArabiaSenegalSerbiaSeychellesSierra LeoneSingaporeSlovak RepublicSloveniaSmall statesSolomon IslandsSomaliaSouth AfricaSouth AsiaSouth Asia (IDA & IBRD)SpainSri LankaSt. Kitts and NevisSt. LuciaSt. Vincent and the GrenadinesSub-Saharan Africa Sub-Saharan Africa (excluding high income)Sub-Saharan Africa (IDA & IBRD countries)SudanSurinameSwedenSwitzerlandSyrian Arab RepublicTajikistanTanzaniaThailandTogoTongaTrinidad and TobagoTunisiaTurkeyTurkmenistanTuvaluUgandaUkraineUnited Arab EmiratesUnited KingdomUnited StatesUpper middle incomeUruguayUzbekistanVanuatuVenezuela, RBVietnamWorldYemen, Rep.ZambiaZimbabwe Zeitlinie:
Diese Zeitleiste vorliegt die Graphik ab 1964 J. bis 2015 J. Kuwait. Die Angaben bis 1963 J. sind nicht vorhanden. Die Zahl aktueller Beobachtungen nach Daten: 51.
Die Quelle (Bezeichnung):
Kennzahlen der Weltentwicklung
Die Quelle (Einrichtung):
World Bank staff estimates based data from International Monetary Fund's Direction of Trade database.
Kategorien:
Private Sector, Trade
Es wurde aktualisiert:
23 Apr 2017 Jahr
Kennzahlen der Wertänderungen vom Jahr zum Jahr
Minimum:
0.018
1 Jan 2004 Jahr
Maximum:
21.833
1 Jan 1991 Jahr
Zum Datum der Beobachtung
Wert
Absolute Veränderung
Die Veränderung bezüglich dem vorherigen Wert
1 Jan 1964 Jahr
15.133
+15.133
0.0%
1 Jan 1965 Jahr
10.357
-4.776
-31.56%
1 Jan 1967 Jahr
4.658
-5.699
-55.03%
1 Jan 1968 Jahr
4.582
-0.076
-1.62%
1 Jan 1969 Jahr
3.771
-0.811
-17.69%
1 Jan 1970 Jahr
3.667
-0.104
-2.77%
1 Jan 1971 Jahr
3.988
+0.321
8.75%
1 Jan 1972 Jahr
4.305
+0.317
7.96%
1 Jan 1973 Jahr
3.411
-0.894
-20.77%
1 Jan 1974 Jahr
5.074
+1.663
48.76%
1 Jan 1975 Jahr
5.129
+0.055
1.08%
1 Jan 1976 Jahr
4.004
-1.125
-21.94%
1 Jan 1977 Jahr
4.034
+0.031
0.76%
1 Jan 1978 Jahr
4.591
+0.556
13.79%
1 Jan 1979 Jahr
4.09
-0.5
-10.9%
1 Jan 1980 Jahr
4.551
+0.461
11.28%
1 Jan 1981 Jahr
3.557
-0.994
-21.85%
1 Jan 1982 Jahr
3.605
+0.048
1.34%
1 Jan 1983 Jahr
3.227
-0.378
-10.49%
1 Jan 1984 Jahr
3.178
-0.049
-1.51%
1 Jan 1985 Jahr
3.481
+0.304
9.56%
1 Jan 1986 Jahr
6.629
+3.147
90.4%
1 Jan 1987 Jahr
7.228
+0.599
9.04%
1 Jan 1988 Jahr
5.85
-1.378
-19.07%
1 Jan 1989 Jahr
5.649
-0.201
-3.44%
1 Jan 1990 Jahr
4.862
-0.786
-13.92%
1 Jan 1991 Jahr
21.833
+16.97
349.01%
1 Jan 1992 Jahr
12.284
-9.548
-43.73%
1 Jan 1993 Jahr
18.351
+6.066
49.38%
1 Jan 1994 Jahr
1.289
-17.061
-92.97%
1 Jan 1995 Jahr
1.755
+0.466
36.14%
1 Jan 1996 Jahr
1.009
-0.746
-42.51%
1 Jan 1997 Jahr
2.614
+1.605
159.0%
1 Jan 1998 Jahr
0.104
-2.509
-96.01%
1 Jan 1999 Jahr
0.019
-0.085
-81.37%
1 Jan 2000 Jahr
0.019
-0.001
-2.78%
1 Jan 2001 Jahr
0.024
+0.006
29.34%
1 Jan 2002 Jahr
0.023
-0.001
-5.29%
1 Jan 2003 Jahr
0.021
-0.002
-9.07%
1 Jan 2004 Jahr
0.018
-0.003
-14.38%
1 Jan 2005 Jahr
0.021
+0.003
15.83%
1 Jan 2006 Jahr
0.022
+0.002
7.22%
1 Jan 2007 Jahr
0.025
+0.003
13.53%
1 Jan 2008 Jahr
0.026
+0.0
0.47%
1 Jan 2009 Jahr
0.027
+0.001
4.35%
1 Jan 2010 Jahr
0.033
+0.007
24.79%
1 Jan 2011 Jahr
0.032
-0.001
-3.91%
1 Jan 2012 Jahr
0.033
+0.002
4.74%
1 Jan 2013 Jahr
0.036
+0.003
8.42%
1 Jan 2014 Jahr
0.037
+0.0
1.26%
1 Jan 2015 Jahr
0.032
-0.005
-12.59%
Bewertung der Länder gemäß mit laufender Statistik nach Jahren


Kommentare: