29
/de/
de
AIzaSyAYiBZKx7MnpbEhh9jyipgxe19OcubqV5w
April 1, 2024
275172
United Arab Emirates
ARE
true
2
1
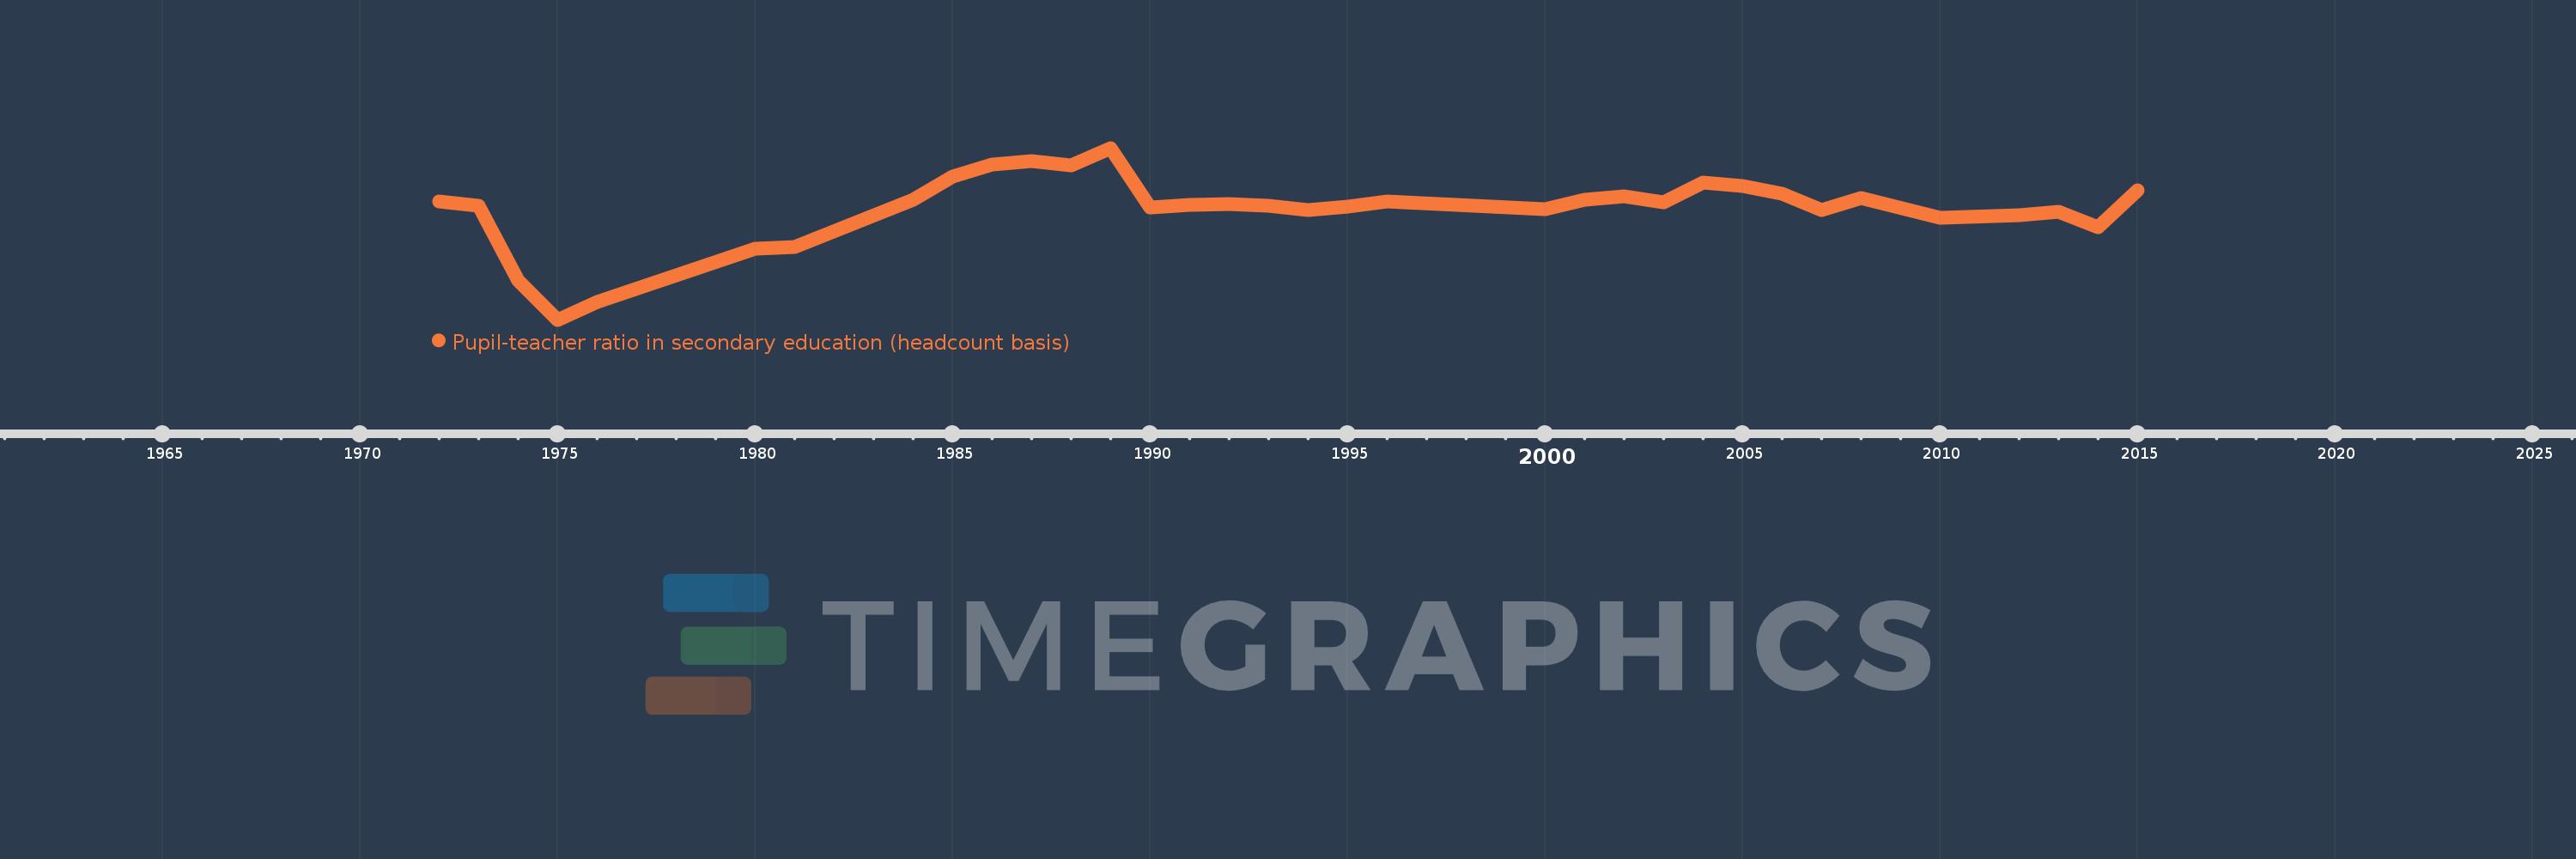
Pupil-teacher ratio in secondary education (headcount basis)
2015,2014,2013,2012,2010,2008,2007,2006,2005,2004,2003,2002,2001,2000,1996,1995,1994,1993,1992,1991,1990,1989,1988,1987,1986,1985,1984,1981,1980,1976,1975,1974,1973,1972
Diese Statistik in anderen Ländern:
AfghanistanAlbaniaAlgeriaAndorraAngolaAntigua and BarbudaArab WorldArgentinaArmeniaArubaAustriaBahamas, TheBahrainBangladeshBarbadosBelarusBelgiumBelizeBeninBermudaBhutanBoliviaBosnia and HerzegovinaBotswanaBrazilBritish Virgin IslandsBrunei DarussalamBulgariaBurkina FasoBurundiCabo VerdeCambodiaCameroonCanadaCaribbean small statesCayman IslandsCentral African RepublicCentral Europe and the BalticsChadChileChinaColombiaComorosCongo, Dem. Rep.Congo, Rep.Costa RicaCote d'IvoireCroatiaCubaCyprusCzech RepublicDenmarkDjiboutiDominicaDominican RepublicEarly-demographic dividendEast Asia & PacificEast Asia & Pacific (excluding high income)East Asia & Pacific (IDA & IBRD countries)EcuadorEgypt, Arab Rep.El SalvadorEquatorial GuineaEritreaEstoniaEthiopiaEuro areaEurope & Central AsiaEurope & Central Asia (excluding high income)Europe & Central Asia (IDA & IBRD countries)European UnionFijiFinlandFragile and conflict affected situationsFranceGabonGambia, TheGeorgiaGermanyGhanaGibraltarGreeceGrenadaGuatemalaGuineaGuinea-BissauGuyanaHaitiHeavily indebted poor countries (HIPC)High incomeHondurasHong Kong SAR, ChinaHungaryIBRD onlyIcelandIDA & IBRD totalIDA blendIDA onlyIDA totalIndiaIndonesiaIran, Islamic Rep.IraqIrelandIsraelItalyJamaicaJapanJordanKazakhstanKenyaKiribatiKorea, Dem. People’s Rep.Korea, Rep.KuwaitKyrgyz RepublicLao PDRLate-demographic dividendLatin America & Caribbean Latin America & Caribbean (excluding high income)Latin America & the Caribbean (IDA & IBRD countries)LatviaLeast developed countries: UN classificationLebanonLesothoLiberiaLibyaLiechtensteinLithuaniaLow & middle incomeLow incomeLower middle incomeLuxembourgMacao SAR, ChinaMacedonia, FYRMadagascarMalawiMalaysiaMaldivesMaliMaltaMarshall IslandsMauritaniaMauritiusMexicoMiddle East & North AfricaMiddle East & North Africa (excluding high income)Middle East & North Africa (IDA & IBRD countries)Middle incomeMoldovaMonacoMongoliaMoroccoMozambiqueMyanmarNamibiaNauruNepalNetherlandsNew ZealandNicaraguaNigerNigeriaNorth AmericaNorwayOECD membersOmanOther small statesPacific island small statesPakistanPalauPanamaPapua New GuineaParaguayPeruPhilippinesPolandPortugalPost-demographic dividendPre-demographic dividendPuerto RicoQatarRomaniaRussian FederationRwandaSamoaSan MarinoSao Tome and PrincipeSaudi ArabiaSenegalSerbiaSeychellesSierra LeoneSingaporeSint Maarten (Dutch part)Slovak RepublicSloveniaSmall statesSolomon IslandsSomaliaSouth AfricaSouth AsiaSouth Asia (IDA & IBRD)SpainSri LankaSt. Kitts and NevisSt. LuciaSt. Vincent and the GrenadinesSub-Saharan Africa Sub-Saharan Africa (excluding high income)Sub-Saharan Africa (IDA & IBRD countries)SudanSurinameSwazilandSwedenSwitzerlandSyrian Arab RepublicTajikistanTanzaniaThailandTimor-LesteTogoTongaTrinidad and TobagoTunisiaTurkeyTurks and Caicos IslandsUgandaUkraineUnited Arab EmiratesUnited KingdomUnited StatesUpper middle incomeUruguayUzbekistanVanuatuVenezuela, RBVietnamWest Bank and GazaWorldYemen, Rep.ZambiaZimbabwe Zeitlinie:
Diese Zeitleiste vorliegt die Graphik ab 1972 J. bis 2015 J. United Arab Emirates. Die Angaben bis 1971 J. sind nicht vorhanden. Die Zahl aktueller Beobachtungen nach Daten: 34.
Die Quelle (Bezeichnung):
Kennzahlen der Weltentwicklung
Die Quelle (Einrichtung):
UNESCO Institute for Statistics
Kategorien:
Education
Es wurde aktualisiert:
23 Apr 2017 Jahr
Kennzahlen der Wertänderungen vom Jahr zum Jahr
Minimum:
7.138
1 Jan 1975 Jahr
Maximum:
15.256
1 Jan 1989 Jahr
Zum Datum der Beobachtung
Wert
Absolute Veränderung
Die Veränderung bezüglich dem vorherigen Wert
1 Jan 1972 Jahr
12.733
+12.733
0.0%
1 Jan 1973 Jahr
12.537
-0.196
-1.54%
1 Jan 1974 Jahr
9.007
-3.53
-28.16%
1 Jan 1975 Jahr
7.138
-1.869
-20.75%
1 Jan 1976 Jahr
7.979
+0.841
11.78%
1 Jan 1980 Jahr
10.49
+2.511
31.47%
1 Jan 1981 Jahr
10.559
+0.07
0.66%
1 Jan 1984 Jahr
12.809
+2.249
21.3%
1 Jan 1985 Jahr
13.893
+1.085
8.47%
1 Jan 1986 Jahr
14.454
+0.561
4.04%
1 Jan 1987 Jahr
14.652
+0.198
1.37%
1 Jan 1988 Jahr
14.449
-0.203
-1.39%
1 Jan 1989 Jahr
15.256
+0.807
5.58%
1 Jan 1990 Jahr
12.449
-2.808
-18.4%
1 Jan 1991 Jahr
12.565
+0.116
0.93%
1 Jan 1992 Jahr
12.596
+0.031
0.24%
1 Jan 1993 Jahr
12.514
-0.081
-0.64%
1 Jan 1994 Jahr
12.307
-0.207
-1.65%
1 Jan 1995 Jahr
12.473
+0.165
1.34%
1 Jan 1996 Jahr
12.709
+0.236
1.9%
1 Jan 2000 Jahr
12.362
-0.347
-2.73%
1 Jan 2001 Jahr
12.806
+0.444
3.59%
1 Jan 2002 Jahr
12.987
+0.181
1.42%
1 Jan 2003 Jahr
12.697
-0.291
-2.24%
1 Jan 2004 Jahr
13.621
+0.925
7.28%
1 Jan 2005 Jahr
13.458
-0.163
-1.2%
1 Jan 2006 Jahr
13.075
-0.383
-2.84%
1 Jan 2007 Jahr
12.333
-0.743
-5.68%
1 Jan 2008 Jahr
12.877
+0.545
4.42%
1 Jan 2010 Jahr
11.941
-0.936
-7.27%
1 Jan 2012 Jahr
12.077
+0.135
1.13%
1 Jan 2013 Jahr
12.258
+0.181
1.5%
1 Jan 2014 Jahr
11.504
-0.754
-6.15%
1 Jan 2015 Jahr
13.273
+1.769
15.38%
Bewertung der Länder gemäß mit laufender Statistik nach Jahren


Kommentare: