29
/de/
de
AIzaSyAYiBZKx7MnpbEhh9jyipgxe19OcubqV5w
April 1, 2024
151974
Hong Kong SAR, China
HKG
true
2
1
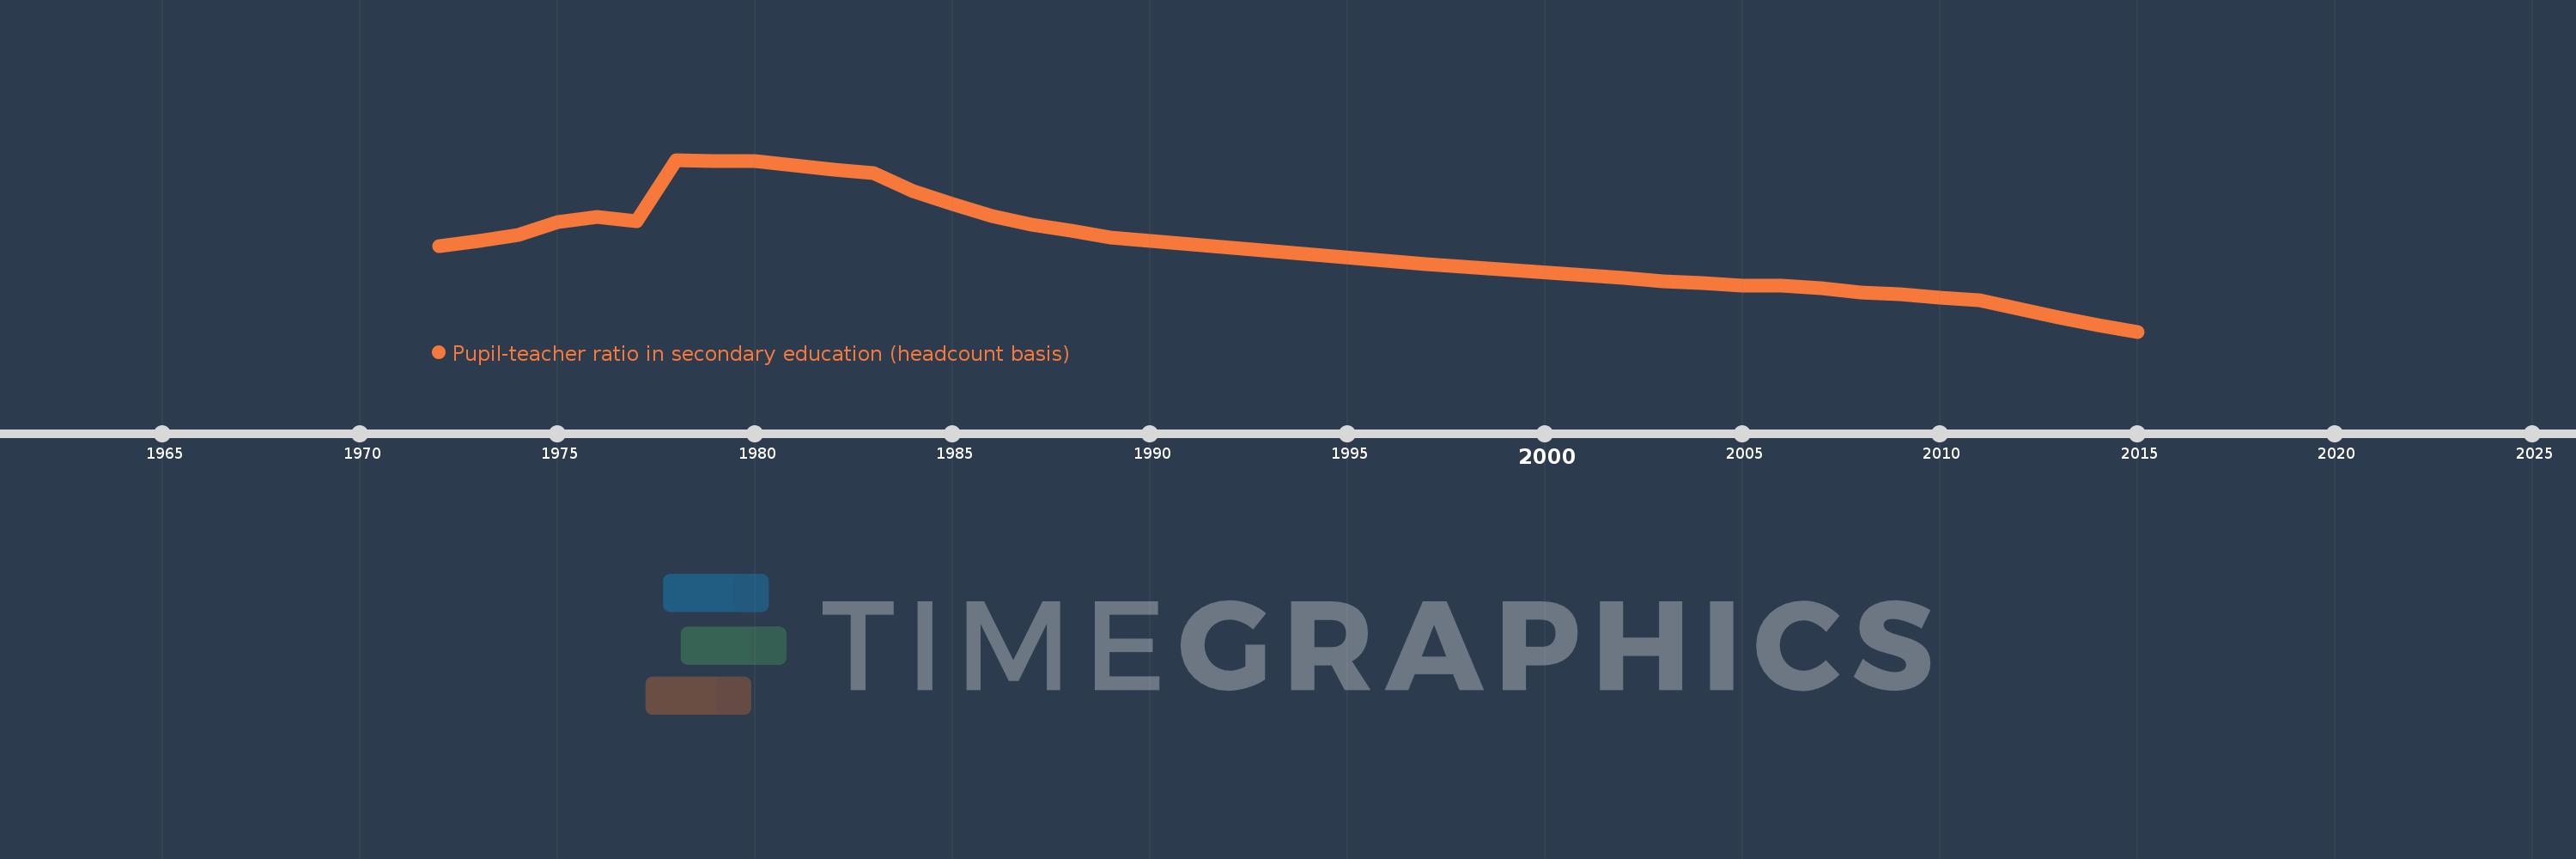
Pupil-teacher ratio in secondary education (headcount basis)
2015,2014,2013,2012,2011,2010,2009,2008,2007,2006,2005,2004,2003,2002,1997,1989,1988,1987,1986,1985,1984,1983,1982,1981,1980,1979,1978,1977,1976,1975,1974,1973,1972
Diese Statistik in anderen Ländern:
AfghanistanAlbaniaAlgeriaAndorraAngolaAntigua and BarbudaArab WorldArgentinaArmeniaArubaAustriaBahamas, TheBahrainBangladeshBarbadosBelarusBelgiumBelizeBeninBermudaBhutanBoliviaBosnia and HerzegovinaBotswanaBrazilBritish Virgin IslandsBrunei DarussalamBulgariaBurkina FasoBurundiCabo VerdeCambodiaCameroonCanadaCaribbean small statesCayman IslandsCentral African RepublicCentral Europe and the BalticsChadChileChinaColombiaComorosCongo, Dem. Rep.Congo, Rep.Costa RicaCote d'IvoireCroatiaCubaCyprusCzech RepublicDenmarkDjiboutiDominicaDominican RepublicEarly-demographic dividendEast Asia & PacificEast Asia & Pacific (excluding high income)East Asia & Pacific (IDA & IBRD countries)EcuadorEgypt, Arab Rep.El SalvadorEquatorial GuineaEritreaEstoniaEthiopiaEuro areaEurope & Central AsiaEurope & Central Asia (excluding high income)Europe & Central Asia (IDA & IBRD countries)European UnionFijiFinlandFragile and conflict affected situationsFranceGabonGambia, TheGeorgiaGermanyGhanaGibraltarGreeceGrenadaGuatemalaGuineaGuinea-BissauGuyanaHaitiHeavily indebted poor countries (HIPC)High incomeHondurasHong Kong SAR, ChinaHungaryIBRD onlyIcelandIDA & IBRD totalIDA blendIDA onlyIDA totalIndiaIndonesiaIran, Islamic Rep.IraqIrelandIsraelItalyJamaicaJapanJordanKazakhstanKenyaKiribatiKorea, Dem. People’s Rep.Korea, Rep.KuwaitKyrgyz RepublicLao PDRLate-demographic dividendLatin America & Caribbean Latin America & Caribbean (excluding high income)Latin America & the Caribbean (IDA & IBRD countries)LatviaLeast developed countries: UN classificationLebanonLesothoLiberiaLibyaLiechtensteinLithuaniaLow & middle incomeLow incomeLower middle incomeLuxembourgMacao SAR, ChinaMacedonia, FYRMadagascarMalawiMalaysiaMaldivesMaliMaltaMarshall IslandsMauritaniaMauritiusMexicoMiddle East & North AfricaMiddle East & North Africa (excluding high income)Middle East & North Africa (IDA & IBRD countries)Middle incomeMoldovaMonacoMongoliaMoroccoMozambiqueMyanmarNamibiaNauruNepalNetherlandsNew ZealandNicaraguaNigerNigeriaNorth AmericaNorwayOECD membersOmanOther small statesPacific island small statesPakistanPalauPanamaPapua New GuineaParaguayPeruPhilippinesPolandPortugalPost-demographic dividendPre-demographic dividendPuerto RicoQatarRomaniaRussian FederationRwandaSamoaSan MarinoSao Tome and PrincipeSaudi ArabiaSenegalSerbiaSeychellesSierra LeoneSingaporeSint Maarten (Dutch part)Slovak RepublicSloveniaSmall statesSolomon IslandsSomaliaSouth AfricaSouth AsiaSouth Asia (IDA & IBRD)SpainSri LankaSt. Kitts and NevisSt. LuciaSt. Vincent and the GrenadinesSub-Saharan Africa Sub-Saharan Africa (excluding high income)Sub-Saharan Africa (IDA & IBRD countries)SudanSurinameSwazilandSwedenSwitzerlandSyrian Arab RepublicTajikistanTanzaniaThailandTimor-LesteTogoTongaTrinidad and TobagoTunisiaTurkeyTurks and Caicos IslandsUgandaUkraineUnited Arab EmiratesUnited KingdomUnited StatesUpper middle incomeUruguayUzbekistanVanuatuVenezuela, RBVietnamWest Bank and GazaWorldYemen, Rep.ZambiaZimbabwe Zeitlinie:
Diese Zeitleiste vorliegt die Graphik ab 1972 J. bis 2015 J. Hong Kong SAR, China. Die Angaben bis 1971 J. sind nicht vorhanden. Die Zahl aktueller Beobachtungen nach Daten: 33.
Die Quelle (Bezeichnung):
Kennzahlen der Weltentwicklung
Die Quelle (Einrichtung):
UNESCO Institute for Statistics
Kategorien:
Education
Es wurde aktualisiert:
23 Apr 2017 Jahr
Kennzahlen der Wertänderungen vom Jahr zum Jahr
Minimum:
13.605
1 Jan 2015 Jahr
Maximum:
30.253
1 Jan 1978 Jahr
Zum Datum der Beobachtung
Wert
Absolute Veränderung
Die Veränderung bezüglich dem vorherigen Wert
1 Jan 1972 Jahr
21.901
+21.901
0.0%
1 Jan 1973 Jahr
22.362
+0.462
2.11%
1 Jan 1974 Jahr
22.949
+0.587
2.62%
1 Jan 1975 Jahr
24.2
+1.251
5.45%
1 Jan 1976 Jahr
24.724
+0.524
2.17%
1 Jan 1977 Jahr
24.335
-0.389
-1.57%
1 Jan 1978 Jahr
30.253
+5.918
24.32%
1 Jan 1979 Jahr
30.154
-0.099
-0.33%
1 Jan 1980 Jahr
30.108
-0.046
-0.15%
1 Jan 1981 Jahr
29.691
-0.417
-1.39%
1 Jan 1982 Jahr
29.337
-0.354
-1.19%
1 Jan 1983 Jahr
28.987
-0.35
-1.19%
1 Jan 1984 Jahr
27.243
-1.744
-6.02%
1 Jan 1985 Jahr
25.936
-1.306
-4.79%
1 Jan 1986 Jahr
24.803
-1.134
-4.37%
1 Jan 1987 Jahr
23.99
-0.812
-3.28%
1 Jan 1988 Jahr
23.371
-0.619
-2.58%
1 Jan 1989 Jahr
22.714
-0.657
-2.81%
1 Jan 1997 Jahr
20.132
-2.583
-11.37%
1 Jan 2002 Jahr
18.839
-1.293
-6.42%
1 Jan 2003 Jahr
18.469
-0.37
-1.96%
1 Jan 2004 Jahr
18.345
-0.123
-0.67%
1 Jan 2005 Jahr
18.038
-0.307
-1.68%
1 Jan 2006 Jahr
18.069
+0.031
0.17%
1 Jan 2007 Jahr
17.826
-0.243
-1.34%
1 Jan 2008 Jahr
17.432
-0.394
-2.21%
1 Jan 2009 Jahr
17.24
-0.192
-1.1%
1 Jan 2010 Jahr
16.887
-0.353
-2.05%
1 Jan 2011 Jahr
16.679
-0.209
-1.23%
1 Jan 2012 Jahr
15.791
-0.887
-5.32%
1 Jan 2013 Jahr
14.987
-0.804
-5.09%
1 Jan 2014 Jahr
14.198
-0.789
-5.27%
1 Jan 2015 Jahr
13.605
-0.593
-4.18%
Bewertung der Länder gemäß mit laufender Statistik nach Jahren


Kommentare: