29
/de/
de
AIzaSyAYiBZKx7MnpbEhh9jyipgxe19OcubqV5w
April 1, 2024
266364
Tonga
TON
true
2
1
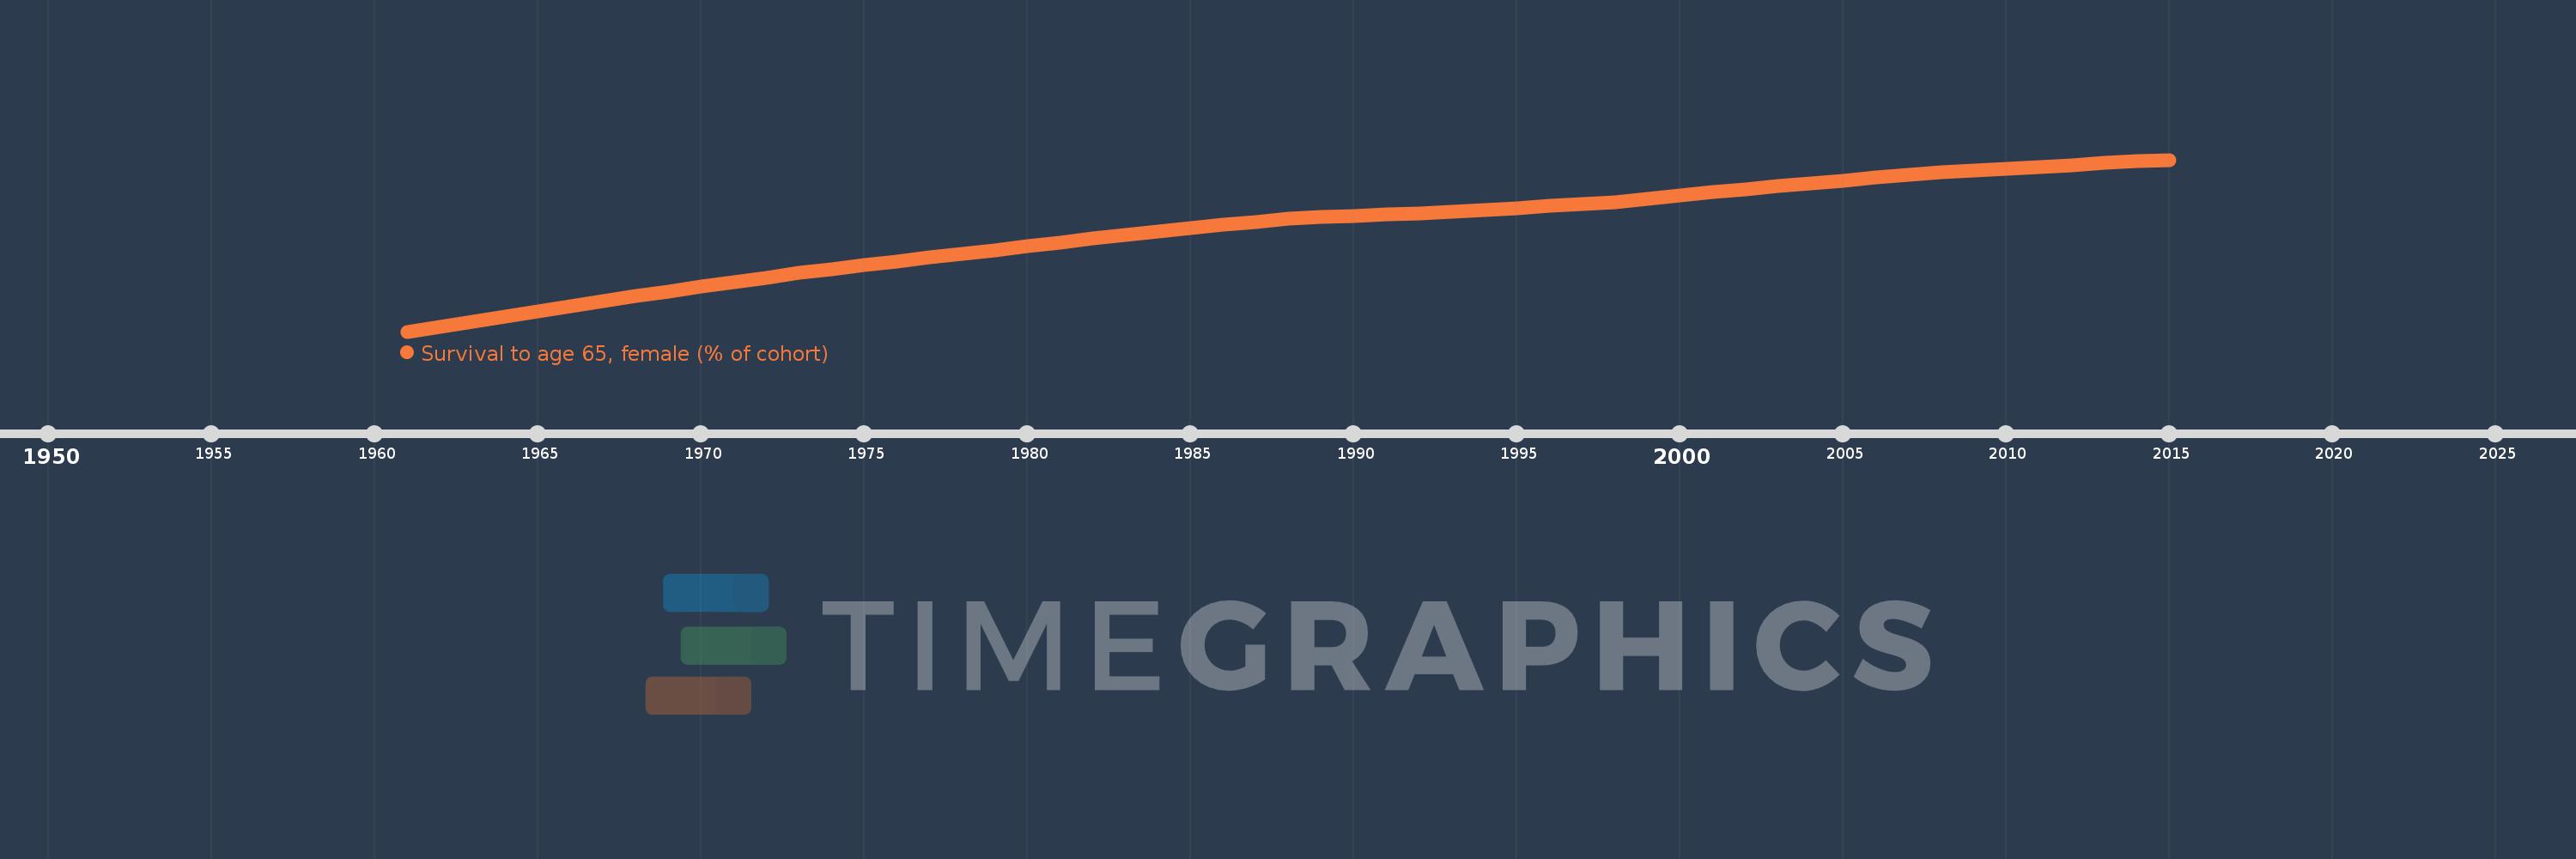
Survival to age 65, female (% of cohort)
2015,2014,2013,2012,2011,2010,2009,2008,2007,2006,2005,2004,2003,2002,2001,2000,1999,1998,1997,1996,1995,1994,1993,1992,1991,1990,1989,1988,1987,1986,1985,1984,1983,1982,1981,1980,1979,1978,1977,1976,1975,1974,1973,1972,1971,1970,1969,1968,1967,1966,1965,1964,1963,1962,1961
Diese Statistik in anderen Ländern:
AfghanistanAlbaniaAlgeriaAngolaAntigua and BarbudaArab WorldArgentinaArmeniaArubaAustraliaAustriaAzerbaijanBahamas, TheBahrainBangladeshBarbadosBelarusBelgiumBelizeBeninBhutanBoliviaBosnia and HerzegovinaBotswanaBrazilBrunei DarussalamBulgariaBurkina FasoBurundiCabo VerdeCambodiaCameroonCanadaCaribbean small statesCentral African RepublicCentral Europe and the BalticsChadChannel IslandsChileChinaColombiaComorosCongo, Dem. Rep.Congo, Rep.Costa RicaCote d'IvoireCroatiaCubaCuracaoCyprusCzech RepublicDenmarkDjiboutiDominican RepublicEarly-demographic dividendEast Asia & PacificEast Asia & Pacific (excluding high income)East Asia & Pacific (IDA & IBRD countries)EcuadorEgypt, Arab Rep.El SalvadorEquatorial GuineaEritreaEstoniaEthiopiaEuro areaEurope & Central AsiaEurope & Central Asia (excluding high income)Europe & Central Asia (IDA & IBRD countries)European UnionFijiFinlandFragile and conflict affected situationsFranceFrench PolynesiaGabonGambia, TheGeorgiaGermanyGhanaGreeceGrenadaGuamGuatemalaGuineaGuinea-BissauGuyanaHaitiHeavily indebted poor countries (HIPC)High incomeHondurasHong Kong SAR, ChinaHungaryIBRD onlyIcelandIDA & IBRD totalIDA blendIDA onlyIDA totalIndiaIndonesiaIran, Islamic Rep.IraqIrelandIsraelItalyJamaicaJapanJordanKazakhstanKenyaKiribatiKorea, Dem. People’s Rep.Korea, Rep.KuwaitKyrgyz RepublicLao PDRLate-demographic dividendLatin America & Caribbean Latin America & Caribbean (excluding high income)Latin America & the Caribbean (IDA & IBRD countries)LatviaLeast developed countries: UN classificationLebanonLesothoLiberiaLibyaLithuaniaLow & middle incomeLow incomeLower middle incomeLuxembourgMacao SAR, ChinaMacedonia, FYRMadagascarMalawiMalaysiaMaldivesMaliMaltaMauritaniaMauritiusMexicoMicronesia, Fed. Sts.Middle East & North AfricaMiddle East & North Africa (excluding high income)Middle East & North Africa (IDA & IBRD countries)Middle incomeMoldovaMongoliaMontenegroMoroccoMozambiqueMyanmarNamibiaNepalNetherlandsNew CaledoniaNew ZealandNicaraguaNigerNigeriaNorth AmericaNorwayOECD membersOmanOther small statesPacific island small statesPakistanPanamaPapua New GuineaParaguayPeruPhilippinesPolandPortugalPost-demographic dividendPre-demographic dividendPuerto RicoQatarRomaniaRussian FederationRwandaSamoaSao Tome and PrincipeSaudi ArabiaSenegalSerbiaSeychellesSierra LeoneSingaporeSlovak RepublicSloveniaSmall statesSolomon IslandsSomaliaSouth AfricaSouth AsiaSouth Asia (IDA & IBRD)South SudanSpainSri LankaSt. LuciaSt. Vincent and the GrenadinesSub-Saharan Africa Sub-Saharan Africa (excluding high income)Sub-Saharan Africa (IDA & IBRD countries)SudanSurinameSwazilandSwedenSwitzerlandSyrian Arab RepublicTajikistanTanzaniaThailandTimor-LesteTogoTongaTrinidad and TobagoTunisiaTurkeyTurkmenistanUgandaUkraineUnited Arab EmiratesUnited KingdomUnited StatesUpper middle incomeUruguayUzbekistanVanuatuVenezuela, RBVietnamVirgin Islands (U.S.)West Bank and GazaWorldYemen, Rep.ZambiaZimbabwe Zeitlinie:
Diese Zeitleiste vorliegt die Graphik ab 1961 J. bis 2015 J. Tonga. Die Angaben bis 1960 J. sind nicht vorhanden. Die Zahl aktueller Beobachtungen nach Daten: 55.
Die Quelle (Bezeichnung):
Kennzahlen der Weltentwicklung
Die Quelle (Einrichtung):
United Nations Population Division. World Population Prospects. New York, United Nations, Department of Economic and Social Affairs (advanced Excel tables). Available at http://esa.un.org/wpp/unpp/panel_population.htm.
Kategorien:
Health, Gender
Es wurde aktualisiert:
23 Apr 2017 Jahr
Kennzahlen der Wertänderungen vom Jahr zum Jahr
Minimum:
57.334
1 Jan 1961 Jahr
Maximum:
82.188
1 Jan 2015 Jahr
Zum Datum der Beobachtung
Wert
Absolute Veränderung
Die Veränderung bezüglich dem vorherigen Wert
1 Jan 1961 Jahr
57.334
+57.334
0.0%
1 Jan 1962 Jahr
58.064
+0.73
1.27%
1 Jan 1963 Jahr
58.795
+0.73
1.26%
1 Jan 1964 Jahr
59.532
+0.738
1.25%
1 Jan 1965 Jahr
60.27
+0.738
1.24%
1 Jan 1966 Jahr
61.008
+0.738
1.22%
1 Jan 1967 Jahr
61.745
+0.738
1.21%
1 Jan 1968 Jahr
62.483
+0.738
1.19%
1 Jan 1969 Jahr
63.149
+0.666
1.07%
1 Jan 1970 Jahr
63.815
+0.666
1.06%
1 Jan 1971 Jahr
64.482
+0.666
1.04%
1 Jan 1972 Jahr
65.148
+0.666
1.03%
1 Jan 1973 Jahr
65.814
+0.666
1.02%
1 Jan 1974 Jahr
66.369
+0.554
0.84%
1 Jan 1975 Jahr
66.923
+0.554
0.84%
1 Jan 1976 Jahr
67.477
+0.554
0.83%
1 Jan 1977 Jahr
68.031
+0.554
0.82%
1 Jan 1978 Jahr
68.586
+0.554
0.81%
1 Jan 1979 Jahr
69.136
+0.551
0.8%
1 Jan 1980 Jahr
69.687
+0.551
0.8%
1 Jan 1981 Jahr
70.238
+0.551
0.79%
1 Jan 1982 Jahr
70.788
+0.551
0.78%
1 Jan 1983 Jahr
71.339
+0.551
0.78%
1 Jan 1984 Jahr
71.812
+0.473
0.66%
1 Jan 1985 Jahr
72.285
+0.473
0.66%
1 Jan 1986 Jahr
72.758
+0.473
0.65%
1 Jan 1987 Jahr
73.231
+0.473
0.65%
1 Jan 1988 Jahr
73.704
+0.473
0.65%
1 Jan 1989 Jahr
73.893
+0.19
0.26%
1 Jan 1990 Jahr
74.083
+0.19
0.26%
1 Jan 1991 Jahr
74.273
+0.19
0.26%
1 Jan 1992 Jahr
74.462
+0.19
0.26%
1 Jan 1993 Jahr
74.652
+0.19
0.25%
1 Jan 1994 Jahr
74.932
+0.28
0.37%
1 Jan 1995 Jahr
75.211
+0.28
0.37%
1 Jan 1996 Jahr
75.491
+0.28
0.37%
1 Jan 1997 Jahr
75.771
+0.28
0.37%
1 Jan 1998 Jahr
76.051
+0.28
0.37%
1 Jan 1999 Jahr
76.526
+0.475
0.62%
1 Jan 2000 Jahr
77.001
+0.475
0.62%
1 Jan 2001 Jahr
77.476
+0.475
0.62%
1 Jan 2002 Jahr
77.951
+0.475
0.61%
1 Jan 2003 Jahr
78.427
+0.475
0.61%
1 Jan 2004 Jahr
78.813
+0.387
0.49%
1 Jan 2005 Jahr
79.2
+0.387
0.49%
1 Jan 2006 Jahr
79.586
+0.387
0.49%
1 Jan 2007 Jahr
79.973
+0.387
0.49%
1 Jan 2008 Jahr
80.36
+0.387
0.48%
1 Jan 2009 Jahr
80.628
+0.269
0.33%
1 Jan 2010 Jahr
80.897
+0.269
0.33%
1 Jan 2011 Jahr
81.166
+0.269
0.33%
1 Jan 2012 Jahr
81.435
+0.269
0.33%
1 Jan 2013 Jahr
81.703
+0.269
0.33%
1 Jan 2014 Jahr
81.946
+0.242
0.3%
1 Jan 2015 Jahr
82.188
+0.242
0.3%
Bewertung der Länder gemäß mit laufender Statistik nach Jahren


Kommentare: