29
/de/
de
AIzaSyAYiBZKx7MnpbEhh9jyipgxe19OcubqV5w
April 1, 2024
159929
Ireland
IRL
true
2
1
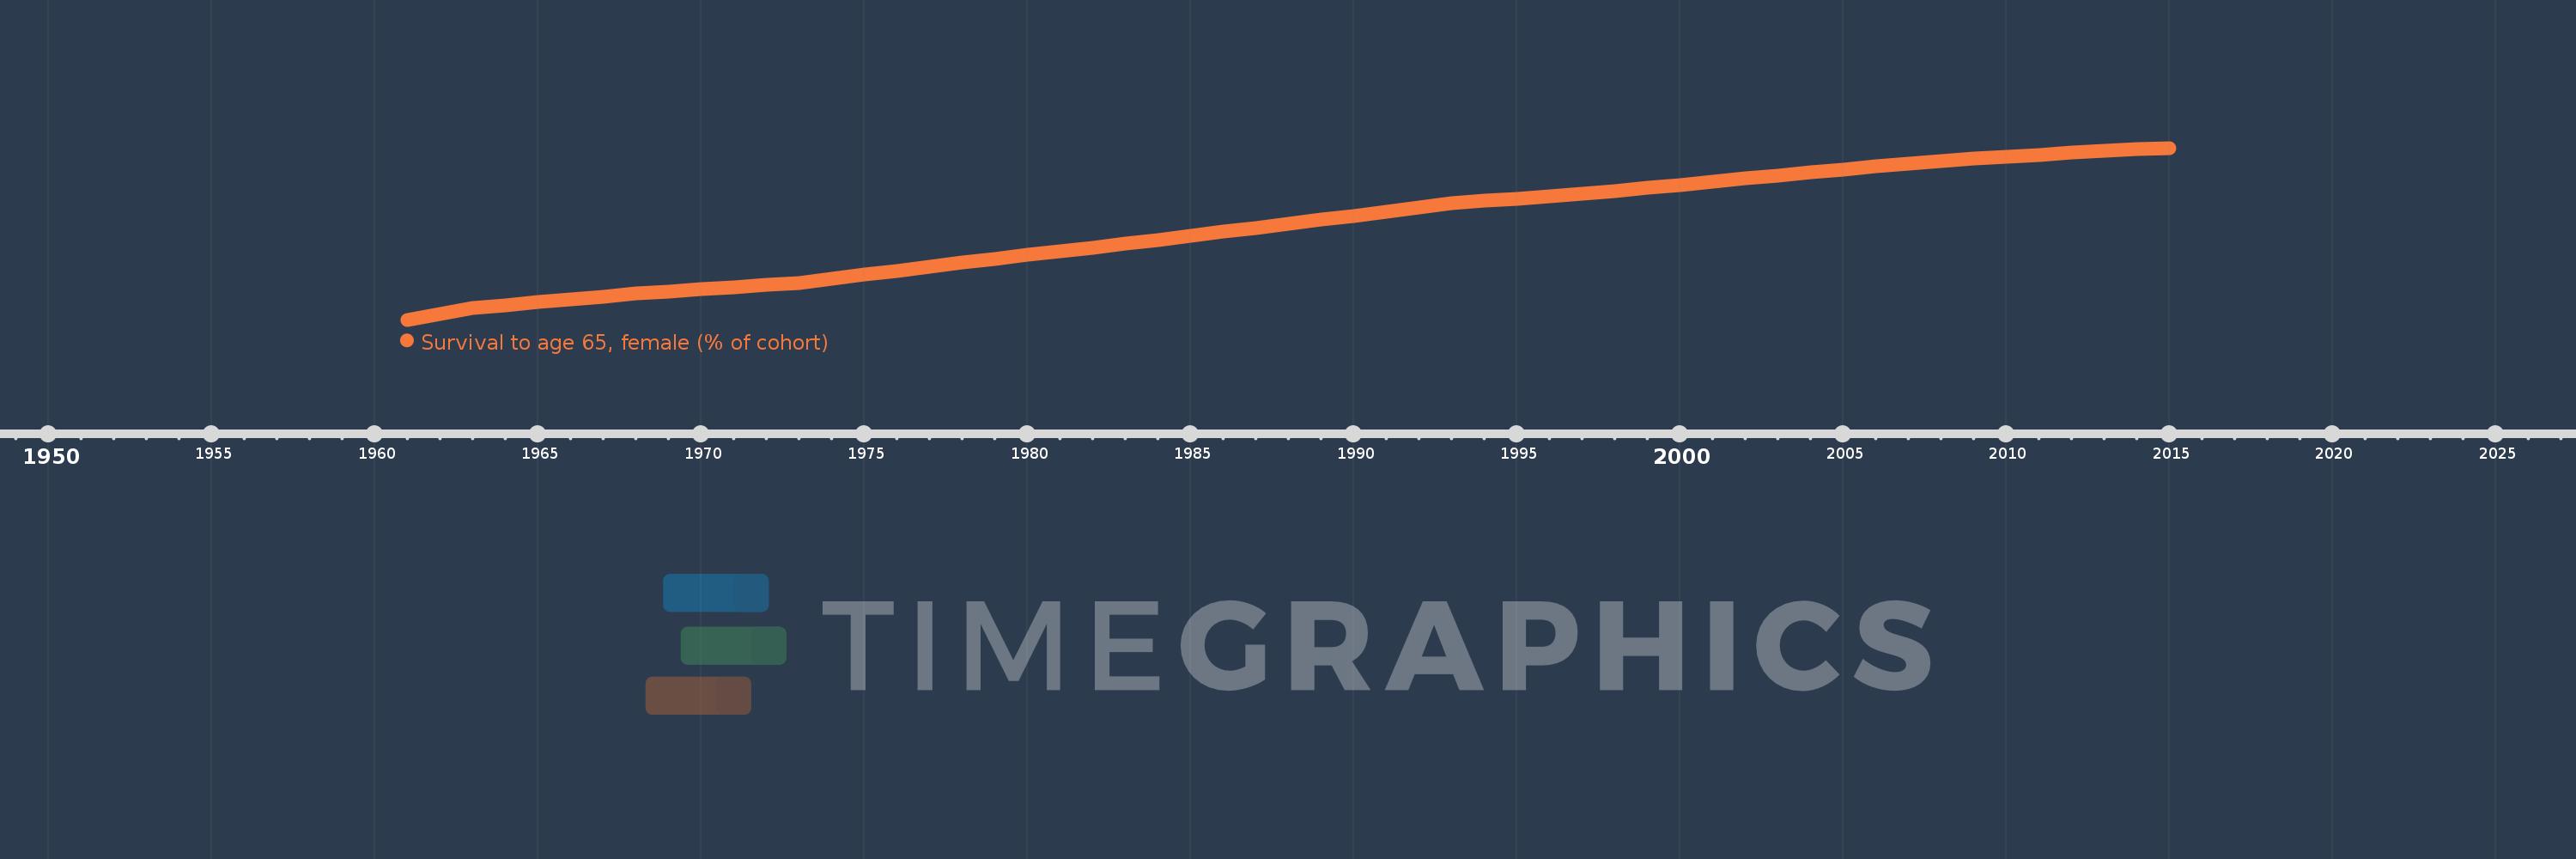
Survival to age 65, female (% of cohort)
2015,2014,2013,2012,2011,2010,2009,2008,2007,2006,2005,2004,2003,2002,2001,2000,1999,1998,1997,1996,1995,1994,1993,1992,1991,1990,1989,1988,1987,1986,1985,1984,1983,1982,1981,1980,1979,1978,1977,1976,1975,1974,1973,1972,1971,1970,1969,1968,1967,1966,1965,1964,1963,1962,1961
Diese Statistik in anderen Ländern:
AfghanistanAlbaniaAlgeriaAngolaAntigua and BarbudaArab WorldArgentinaArmeniaArubaAustraliaAustriaAzerbaijanBahamas, TheBahrainBangladeshBarbadosBelarusBelgiumBelizeBeninBhutanBoliviaBosnia and HerzegovinaBotswanaBrazilBrunei DarussalamBulgariaBurkina FasoBurundiCabo VerdeCambodiaCameroonCanadaCaribbean small statesCentral African RepublicCentral Europe and the BalticsChadChannel IslandsChileChinaColombiaComorosCongo, Dem. Rep.Congo, Rep.Costa RicaCote d'IvoireCroatiaCubaCuracaoCyprusCzech RepublicDenmarkDjiboutiDominican RepublicEarly-demographic dividendEast Asia & PacificEast Asia & Pacific (excluding high income)East Asia & Pacific (IDA & IBRD countries)EcuadorEgypt, Arab Rep.El SalvadorEquatorial GuineaEritreaEstoniaEthiopiaEuro areaEurope & Central AsiaEurope & Central Asia (excluding high income)Europe & Central Asia (IDA & IBRD countries)European UnionFijiFinlandFragile and conflict affected situationsFranceFrench PolynesiaGabonGambia, TheGeorgiaGermanyGhanaGreeceGrenadaGuamGuatemalaGuineaGuinea-BissauGuyanaHaitiHeavily indebted poor countries (HIPC)High incomeHondurasHong Kong SAR, ChinaHungaryIBRD onlyIcelandIDA & IBRD totalIDA blendIDA onlyIDA totalIndiaIndonesiaIran, Islamic Rep.IraqIrelandIsraelItalyJamaicaJapanJordanKazakhstanKenyaKiribatiKorea, Dem. People’s Rep.Korea, Rep.KuwaitKyrgyz RepublicLao PDRLate-demographic dividendLatin America & Caribbean Latin America & Caribbean (excluding high income)Latin America & the Caribbean (IDA & IBRD countries)LatviaLeast developed countries: UN classificationLebanonLesothoLiberiaLibyaLithuaniaLow & middle incomeLow incomeLower middle incomeLuxembourgMacao SAR, ChinaMacedonia, FYRMadagascarMalawiMalaysiaMaldivesMaliMaltaMauritaniaMauritiusMexicoMicronesia, Fed. Sts.Middle East & North AfricaMiddle East & North Africa (excluding high income)Middle East & North Africa (IDA & IBRD countries)Middle incomeMoldovaMongoliaMontenegroMoroccoMozambiqueMyanmarNamibiaNepalNetherlandsNew CaledoniaNew ZealandNicaraguaNigerNigeriaNorth AmericaNorwayOECD membersOmanOther small statesPacific island small statesPakistanPanamaPapua New GuineaParaguayPeruPhilippinesPolandPortugalPost-demographic dividendPre-demographic dividendPuerto RicoQatarRomaniaRussian FederationRwandaSamoaSao Tome and PrincipeSaudi ArabiaSenegalSerbiaSeychellesSierra LeoneSingaporeSlovak RepublicSloveniaSmall statesSolomon IslandsSomaliaSouth AfricaSouth AsiaSouth Asia (IDA & IBRD)South SudanSpainSri LankaSt. LuciaSt. Vincent and the GrenadinesSub-Saharan Africa Sub-Saharan Africa (excluding high income)Sub-Saharan Africa (IDA & IBRD countries)SudanSurinameSwazilandSwedenSwitzerlandSyrian Arab RepublicTajikistanTanzaniaThailandTimor-LesteTogoTongaTrinidad and TobagoTunisiaTurkeyTurkmenistanUgandaUkraineUnited Arab EmiratesUnited KingdomUnited StatesUpper middle incomeUruguayUzbekistanVanuatuVenezuela, RBVietnamVirgin Islands (U.S.)West Bank and GazaWorldYemen, Rep.ZambiaZimbabwe Zeitlinie:
Diese Zeitleiste vorliegt die Graphik ab 1961 J. bis 2015 J. Ireland. Die Angaben bis 1960 J. sind nicht vorhanden. Die Zahl aktueller Beobachtungen nach Daten: 55.
Die Quelle (Bezeichnung):
Kennzahlen der Weltentwicklung
Die Quelle (Einrichtung):
United Nations Population Division. World Population Prospects. New York, United Nations, Department of Economic and Social Affairs (advanced Excel tables). Available at http://esa.un.org/wpp/unpp/panel_population.htm.
Kategorien:
Health, Gender
Es wurde aktualisiert:
23 Apr 2017 Jahr
Kennzahlen der Wertänderungen vom Jahr zum Jahr
Minimum:
76.676
1 Jan 1961 Jahr
Maximum:
91.962
1 Jan 2015 Jahr
Zum Datum der Beobachtung
Wert
Absolute Veränderung
Die Veränderung bezüglich dem vorherigen Wert
1 Jan 1961 Jahr
76.676
+76.676
0.0%
1 Jan 1962 Jahr
77.19
+0.514
0.67%
1 Jan 1963 Jahr
77.704
+0.514
0.67%
1 Jan 1964 Jahr
77.965
+0.261
0.34%
1 Jan 1965 Jahr
78.226
+0.261
0.33%
1 Jan 1966 Jahr
78.487
+0.261
0.33%
1 Jan 1967 Jahr
78.748
+0.261
0.33%
1 Jan 1968 Jahr
79.009
+0.261
0.33%
1 Jan 1969 Jahr
79.197
+0.189
0.24%
1 Jan 1970 Jahr
79.386
+0.189
0.24%
1 Jan 1971 Jahr
79.574
+0.189
0.24%
1 Jan 1972 Jahr
79.763
+0.189
0.24%
1 Jan 1973 Jahr
79.951
+0.189
0.24%
1 Jan 1974 Jahr
80.313
+0.361
0.45%
1 Jan 1975 Jahr
80.674
+0.361
0.45%
1 Jan 1976 Jahr
81.035
+0.361
0.45%
1 Jan 1977 Jahr
81.397
+0.361
0.45%
1 Jan 1978 Jahr
81.758
+0.361
0.44%
1 Jan 1979 Jahr
82.094
+0.336
0.41%
1 Jan 1980 Jahr
82.43
+0.336
0.41%
1 Jan 1981 Jahr
82.766
+0.336
0.41%
1 Jan 1982 Jahr
83.103
+0.336
0.41%
1 Jan 1983 Jahr
83.439
+0.336
0.4%
1 Jan 1984 Jahr
83.792
+0.353
0.42%
1 Jan 1985 Jahr
84.144
+0.353
0.42%
1 Jan 1986 Jahr
84.497
+0.353
0.42%
1 Jan 1987 Jahr
84.85
+0.353
0.42%
1 Jan 1988 Jahr
85.203
+0.353
0.42%
1 Jan 1989 Jahr
85.567
+0.364
0.43%
1 Jan 1990 Jahr
85.931
+0.364
0.43%
1 Jan 1991 Jahr
86.295
+0.364
0.42%
1 Jan 1992 Jahr
86.659
+0.364
0.42%
1 Jan 1993 Jahr
87.022
+0.364
0.42%
1 Jan 1994 Jahr
87.239
+0.217
0.25%
1 Jan 1995 Jahr
87.456
+0.217
0.25%
1 Jan 1996 Jahr
87.673
+0.217
0.25%
1 Jan 1997 Jahr
87.889
+0.217
0.25%
1 Jan 1998 Jahr
88.106
+0.217
0.25%
1 Jan 1999 Jahr
88.389
+0.283
0.32%
1 Jan 2000 Jahr
88.672
+0.283
0.32%
1 Jan 2001 Jahr
88.954
+0.283
0.32%
1 Jan 2002 Jahr
89.237
+0.283
0.32%
1 Jan 2003 Jahr
89.52
+0.283
0.32%
1 Jan 2004 Jahr
89.78
+0.259
0.29%
1 Jan 2005 Jahr
90.039
+0.259
0.29%
1 Jan 2006 Jahr
90.299
+0.259
0.29%
1 Jan 2007 Jahr
90.558
+0.259
0.29%
1 Jan 2008 Jahr
90.817
+0.259
0.29%
1 Jan 2009 Jahr
90.996
+0.179
0.2%
1 Jan 2010 Jahr
91.175
+0.179
0.2%
1 Jan 2011 Jahr
91.354
+0.179
0.2%
1 Jan 2012 Jahr
91.533
+0.179
0.2%
1 Jan 2013 Jahr
91.712
+0.179
0.2%
1 Jan 2014 Jahr
91.837
+0.125
0.14%
1 Jan 2015 Jahr
91.962
+0.125
0.14%
Bewertung der Länder gemäß mit laufender Statistik nach Jahren


Kommentare: