30
/de/
AIzaSyAYiBZKx7MnpbEhh9jyipgxe19OcubqV5w
April 1, 2024
263766
Timor-Leste
TLS
true
2
1
Net bilateral aid flows from DAC donors, Finland (current US$)
2015,2014,2013,2012,2011,2010,2009,2008,2007,2006,2005,2004,2003,2002,2001,1982,1981
Download
Bibliothek der Globalstatistik →Timor-Leste →

Net bilateral aid flows from DAC donors, Finland (current US$)

Diese Statistik in anderen Ländern:

AfghanistanAlbaniaAlgeriaAngolaAntigua and BarbudaArab WorldArgentinaArmeniaAzerbaijanBahamas, TheBahrainBangladeshBarbadosBelarusBelizeBeninBhutanBoliviaBosnia and HerzegovinaBotswanaBrazilBrunei DarussalamBulgariaBurkina FasoBurundiCabo VerdeCambodiaCameroonCaribbean small statesCayman IslandsCentral African RepublicCentral Europe and the BalticsChadChileChinaColombiaComorosCongo, Dem. Rep.Congo, Rep.Costa RicaCote d'IvoireCroatiaCubaCyprusCzech RepublicDjiboutiDominicaDominican RepublicEast Asia & PacificEast Asia & Pacific (excluding high income)East Asia & Pacific (IDA & IBRD countries)EcuadorEgypt, Arab Rep.El SalvadorEquatorial GuineaEritreaEstoniaEthiopiaEuro areaEurope & Central AsiaEurope & Central Asia (excluding high income)Europe & Central Asia (IDA & IBRD countries)European UnionFijiFragile and conflict affected situationsFrench PolynesiaGabonGambia, TheGeorgiaGhanaGrenadaGuatemalaGuineaGuinea-BissauGuyanaHaitiHeavily indebted poor countries (HIPC)High incomeHondurasHong Kong SAR, ChinaHungaryIBRD onlyIDA & IBRD totalIDA blendIDA onlyIDA totalIndiaIndonesiaIran, Islamic Rep.IraqIsraelJamaicaJordanKazakhstanKenyaKiribatiKorea, Dem. People’s Rep.Korea, Rep.KosovoKuwaitKyrgyz RepublicLao PDRLatin America & Caribbean Latin America & Caribbean (excluding high income)Latin America & the Caribbean (IDA & IBRD countries)LatviaLeast developed countries: UN classificationLebanonLesothoLiberiaLibyaLithuaniaLow & middle incomeLow incomeLower middle incomeMacedonia, FYRMadagascarMalawiMalaysiaMaldivesMaliMauritaniaMauritiusMexicoMiddle East & North AfricaMiddle East & North Africa (excluding high income)Middle East & North Africa (IDA & IBRD countries)Middle incomeMoldovaMongoliaMontenegroMoroccoMozambiqueMyanmarNamibiaNepalNew CaledoniaNicaraguaNigerNigeriaNorthern Mariana IslandsOECD membersOmanOther small statesPacific island small statesPakistanPalauPanamaPapua New GuineaParaguayPeruPhilippinesPolandRomaniaRussian FederationRwandaSamoaSao Tome and PrincipeSaudi ArabiaSenegalSerbiaSeychellesSierra LeoneSingaporeSlovak RepublicSmall statesSolomon IslandsSomaliaSouth AfricaSouth AsiaSouth Asia (IDA & IBRD)South SudanSri LankaSt. Kitts and NevisSt. LuciaSt. Vincent and the GrenadinesSub-Saharan Africa Sub-Saharan Africa (excluding high income)Sub-Saharan Africa (IDA & IBRD countries)SudanSurinameSwazilandSyrian Arab RepublicTajikistanTanzaniaThailandTimor-LesteTogoTongaTrinidad and TobagoTunisiaTurkeyTurkmenistanTuvaluUgandaUkraineUnited Arab EmiratesUpper middle incomeUruguayUzbekistanVanuatuVenezuela, RBVietnamWest Bank and GazaWorldYemen, Rep.ZambiaZimbabwe

Zeitlinie:

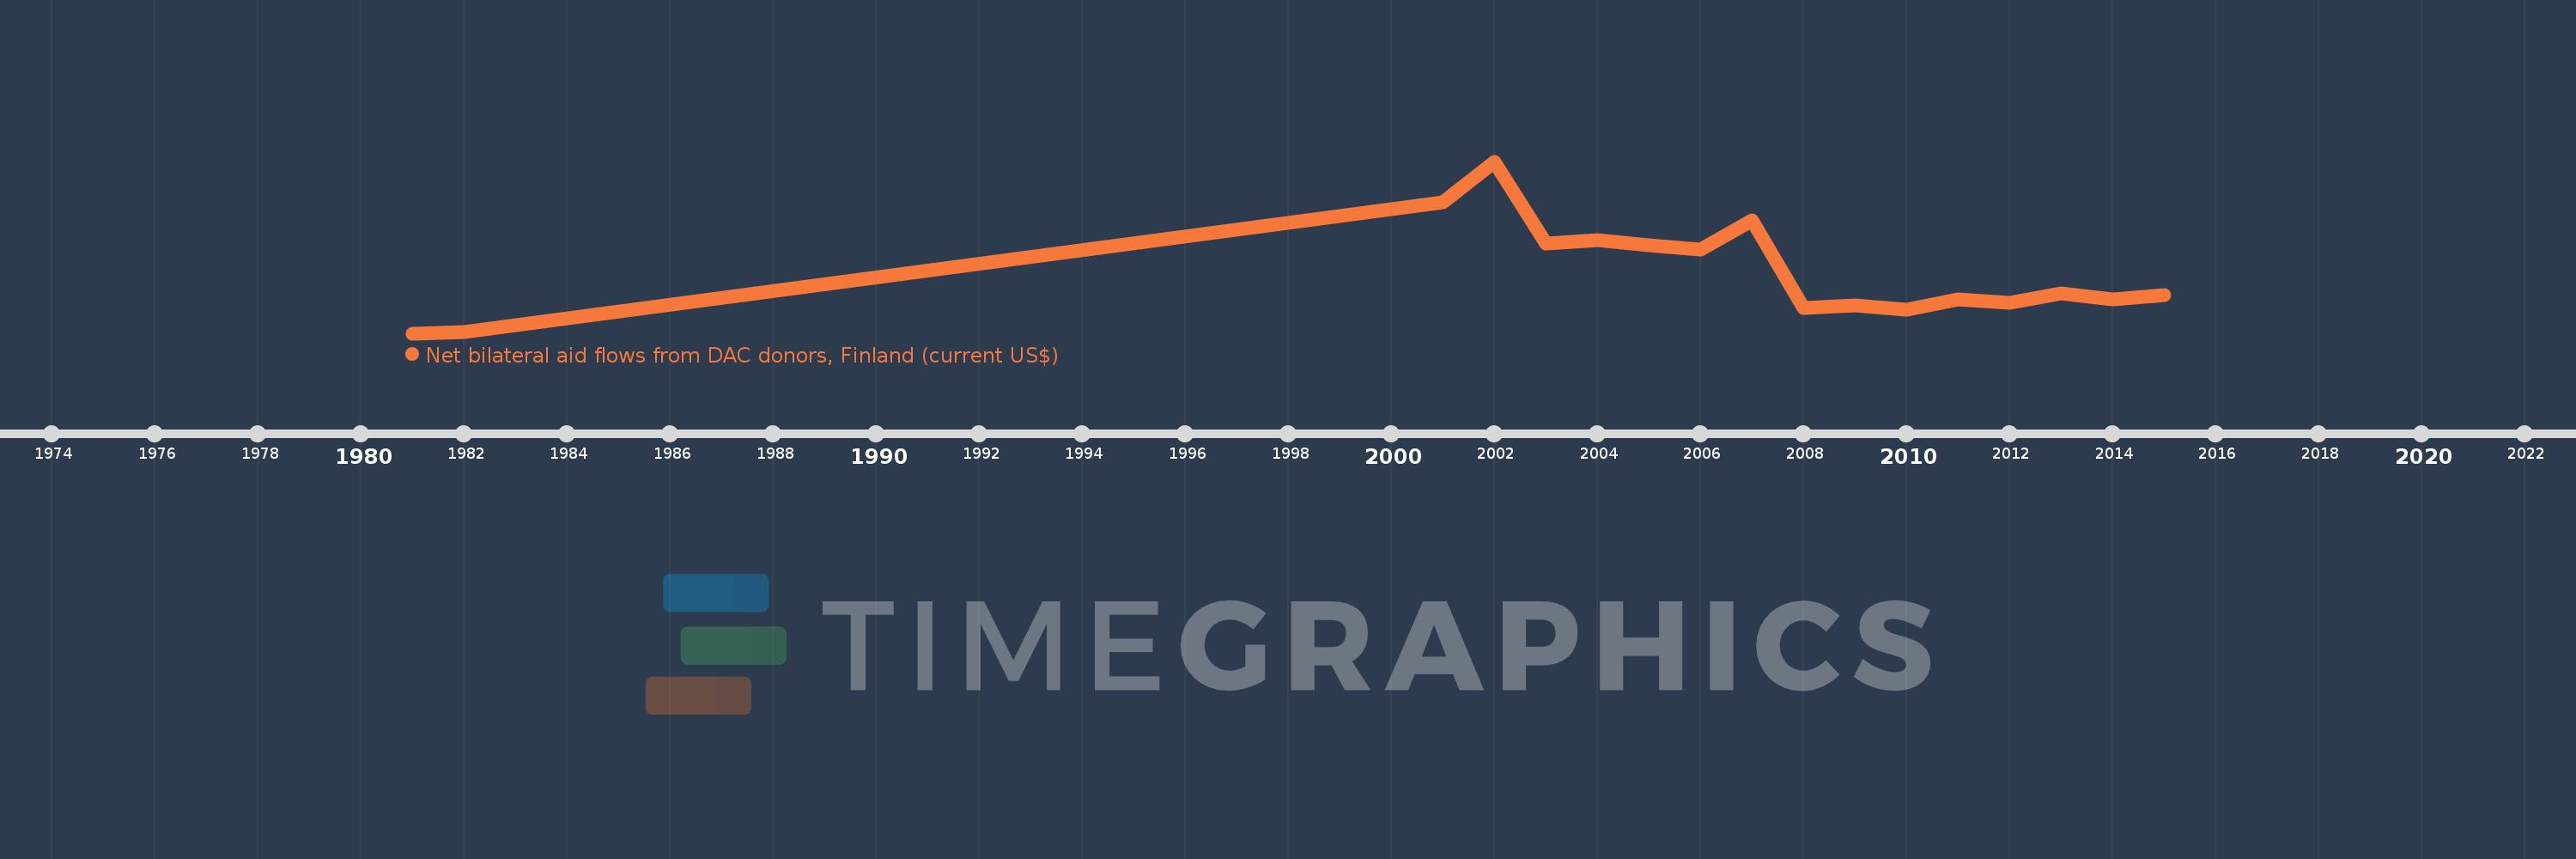
Diese Zeitleiste vorliegt die Graphik ab 1981 J. bis 2015 J. Timor-Leste. Die Angaben bis 1980 J. sind nicht vorhanden. Die Zahl aktueller Beobachtungen nach Daten: 17.

Die Quelle (Bezeichnung):

Kennzahlen der Weltentwicklung

Die Quelle (Einrichtung):

Development Assistance Committee of the Organisation for Economic Co-operation and Development, Geographical Distribution of Financial Flows to Developing Countries, Development Co-operation Report, and International Development Statistics database. Data are available online at: www.oecd.org/dac/stats/idsonline.

Kategorien:

Aid Effectiveness

Es wurde aktualisiert:

23 Apr 2017 Jahr

Kennzahlen der Wertänderungen vom Jahr zum Jahr

im Durchschnitt:
1.288 Mln.
Minimum:
30.0 Tsnd.
1 Jan 1981 Jahr
Maximum:
3.61 Mln.
1 Jan 2002 Jahr
Zum Datum der Beobachtung
Wert
Absolute Veränderung
Die Veränderung bezüglich dem vorherigen Wert
1 Jan 1981 Jahr
30.0 Tsnd.
+30.0 Tsnd.
0.0%
1 Jan 1982 Jahr
50.0 Tsnd.
+20.0 Tsnd.
66.67%
1 Jan 2001 Jahr
2.76 Mln.
+2.71 Mln.
5.42 Tsnd.%
1 Jan 2002 Jahr
3.61 Mln.
+850.0 Tsnd.
30.8%
1 Jan 2003 Jahr
1.9 Mln.
-1.71 Mln.
-47.37%
1 Jan 2004 Jahr
1.97 Mln.
+70.0 Tsnd.
3.68%
1 Jan 2005 Jahr
1.87 Mln.
-100.0 Tsnd.
-5.08%
1 Jan 2006 Jahr
1.78 Mln.
-90.0 Tsnd.
-4.81%
1 Jan 2007 Jahr
2.39 Mln.
+610.0 Tsnd.
34.27%
1 Jan 2008 Jahr
560.0 Tsnd.
-1.83 Mln.
-76.57%
1 Jan 2009 Jahr
620.0 Tsnd.
+60.0 Tsnd.
10.71%
1 Jan 2010 Jahr
520.0 Tsnd.
-100.0 Tsnd.
-16.13%
1 Jan 2011 Jahr
730.0 Tsnd.
+210.0 Tsnd.
40.38%
1 Jan 2012 Jahr
670.0 Tsnd.
-60.0 Tsnd.
-8.22%
1 Jan 2013 Jahr
870.0 Tsnd.
+200.0 Tsnd.
29.85%
1 Jan 2014 Jahr
730.0 Tsnd.
-140.0 Tsnd.
-16.09%
1 Jan 2015 Jahr
830.0 Tsnd.
+100.0 Tsnd.
13.7%

Bewertung der Länder gemäß mit laufender Statistik nach Jahren