29
/de/
de
AIzaSyAYiBZKx7MnpbEhh9jyipgxe19OcubqV5w
April 1, 2024
123833
Ecuador
ECU
true
2
1
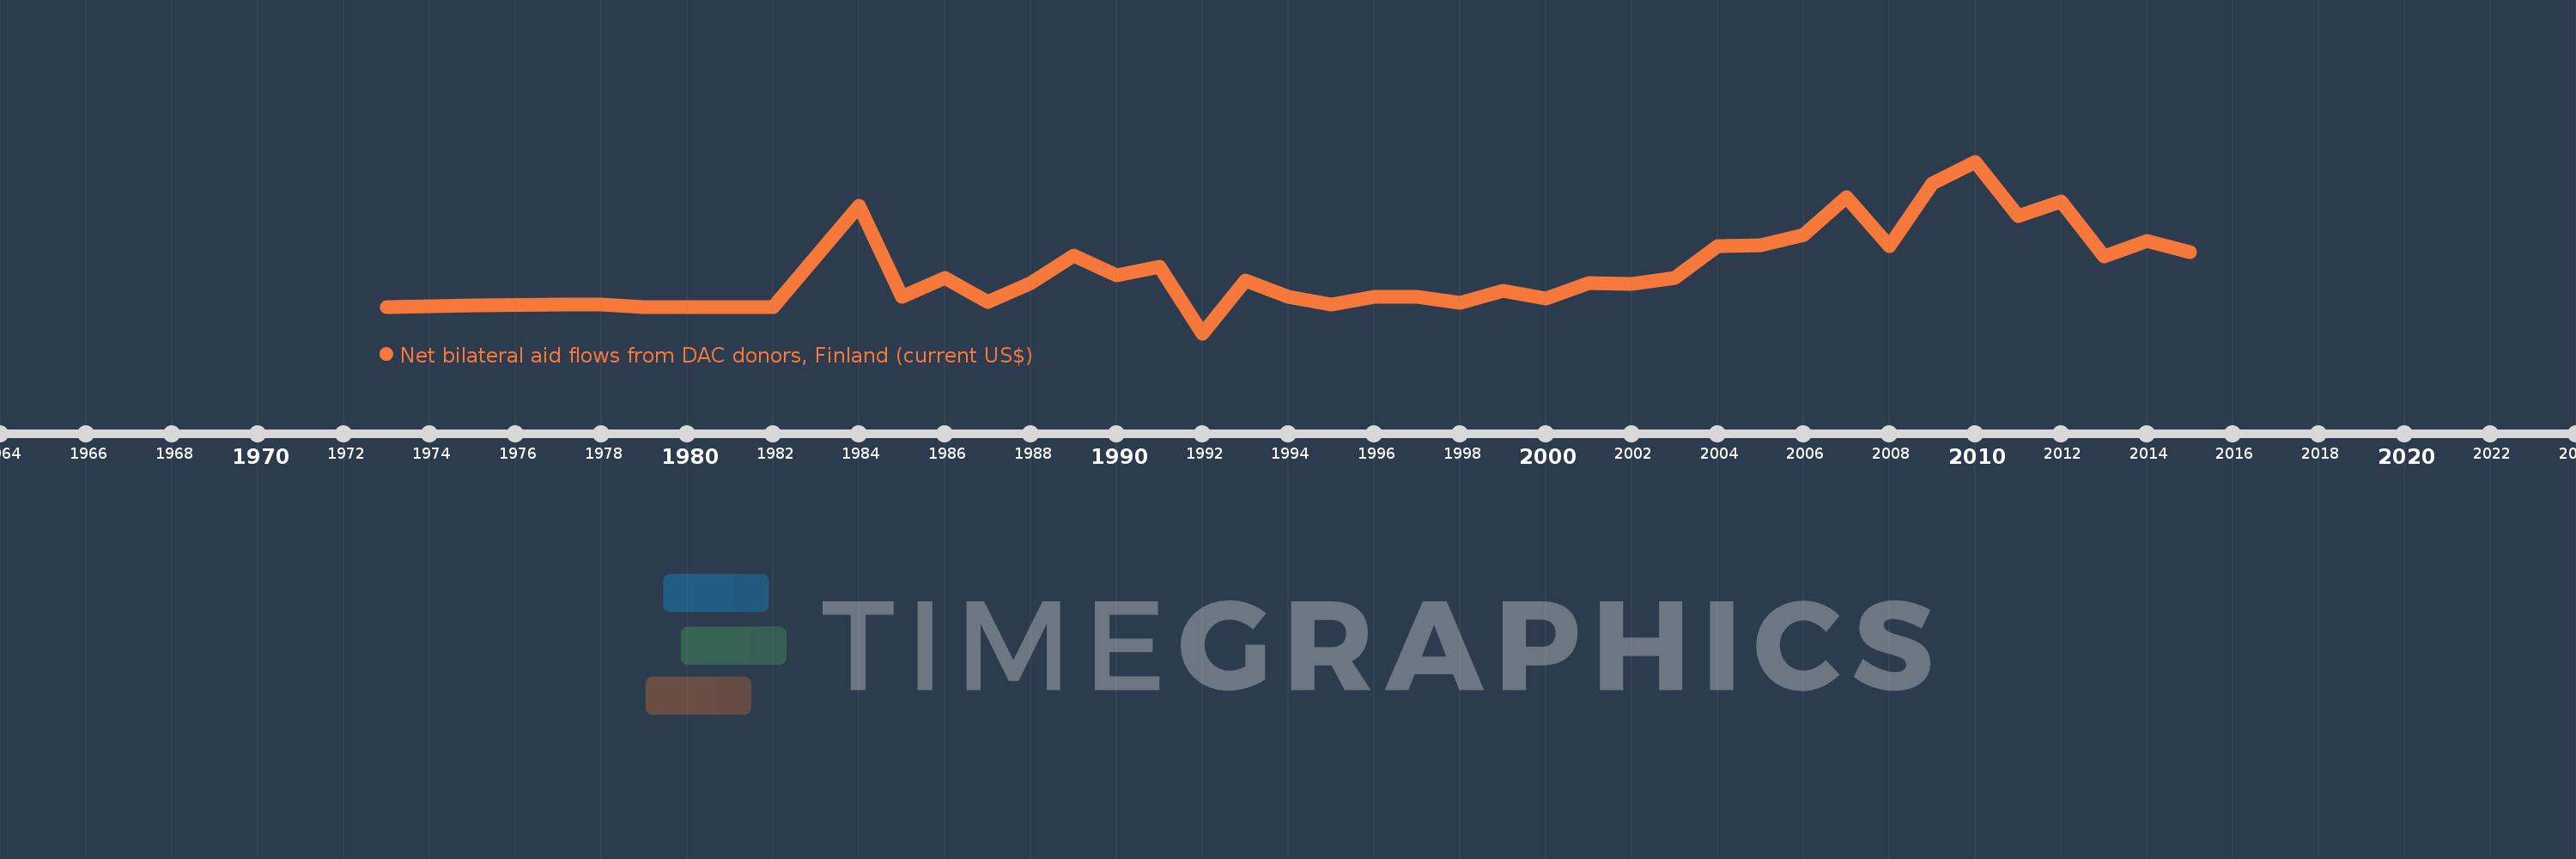
Net bilateral aid flows from DAC donors, Finland (current US$)
2015,2014,2013,2012,2011,2010,2009,2008,2007,2006,2005,2004,2003,2002,2001,2000,1999,1998,1997,1996,1995,1994,1993,1992,1991,1990,1989,1988,1987,1986,1985,1984,1982,1979,1978,1977,1975,1973
Diese Statistik in anderen Ländern:
AfghanistanAlbaniaAlgeriaAngolaAntigua and BarbudaArab WorldArgentinaArmeniaAzerbaijanBahamas, TheBahrainBangladeshBarbadosBelarusBelizeBeninBhutanBoliviaBosnia and HerzegovinaBotswanaBrazilBrunei DarussalamBulgariaBurkina FasoBurundiCabo VerdeCambodiaCameroonCaribbean small statesCayman IslandsCentral African RepublicCentral Europe and the BalticsChadChileChinaColombiaComorosCongo, Dem. Rep.Congo, Rep.Costa RicaCote d'IvoireCroatiaCubaCyprusCzech RepublicDjiboutiDominicaDominican RepublicEast Asia & PacificEast Asia & Pacific (excluding high income)East Asia & Pacific (IDA & IBRD countries)EcuadorEgypt, Arab Rep.El SalvadorEquatorial GuineaEritreaEstoniaEthiopiaEuro areaEurope & Central AsiaEurope & Central Asia (excluding high income)Europe & Central Asia (IDA & IBRD countries)European UnionFijiFragile and conflict affected situationsFrench PolynesiaGabonGambia, TheGeorgiaGhanaGrenadaGuatemalaGuineaGuinea-BissauGuyanaHaitiHeavily indebted poor countries (HIPC)High incomeHondurasHong Kong SAR, ChinaHungaryIBRD onlyIDA & IBRD totalIDA blendIDA onlyIDA totalIndiaIndonesiaIran, Islamic Rep.IraqIsraelJamaicaJordanKazakhstanKenyaKiribatiKorea, Dem. People’s Rep.Korea, Rep.KosovoKuwaitKyrgyz RepublicLao PDRLatin America & Caribbean Latin America & Caribbean (excluding high income)Latin America & the Caribbean (IDA & IBRD countries)LatviaLeast developed countries: UN classificationLebanonLesothoLiberiaLibyaLithuaniaLow & middle incomeLow incomeLower middle incomeMacedonia, FYRMadagascarMalawiMalaysiaMaldivesMaliMauritaniaMauritiusMexicoMiddle East & North AfricaMiddle East & North Africa (excluding high income)Middle East & North Africa (IDA & IBRD countries)Middle incomeMoldovaMongoliaMontenegroMoroccoMozambiqueMyanmarNamibiaNepalNew CaledoniaNicaraguaNigerNigeriaNorthern Mariana IslandsOECD membersOmanOther small statesPacific island small statesPakistanPalauPanamaPapua New GuineaParaguayPeruPhilippinesPolandRomaniaRussian FederationRwandaSamoaSao Tome and PrincipeSaudi ArabiaSenegalSerbiaSeychellesSierra LeoneSingaporeSlovak RepublicSmall statesSolomon IslandsSomaliaSouth AfricaSouth AsiaSouth Asia (IDA & IBRD)South SudanSri LankaSt. Kitts and NevisSt. LuciaSt. Vincent and the GrenadinesSub-Saharan Africa Sub-Saharan Africa (excluding high income)Sub-Saharan Africa (IDA & IBRD countries)SudanSurinameSwazilandSyrian Arab RepublicTajikistanTanzaniaThailandTimor-LesteTogoTongaTrinidad and TobagoTunisiaTurkeyTurkmenistanTuvaluUgandaUkraineUnited Arab EmiratesUpper middle incomeUruguayUzbekistanVanuatuVenezuela, RBVietnamWest Bank and GazaWorldYemen, Rep.ZambiaZimbabwe Zeitlinie:
Diese Zeitleiste vorliegt die Graphik ab 1973 J. bis 2015 J. Ecuador. Die Angaben bis 1972 J. sind nicht vorhanden. Die Zahl aktueller Beobachtungen nach Daten: 38.
Die Quelle (Bezeichnung):
Kennzahlen der Weltentwicklung
Die Quelle (Einrichtung):
Development Assistance Committee of the Organisation for Economic Co-operation and Development, Geographical Distribution of Financial Flows to Developing Countries, Development Co-operation Report, and International Development Statistics database. Data are available online at: www.oecd.org/dac/stats/idsonline.
Kategorien:
Aid Effectiveness
Es wurde aktualisiert:
23 Apr 2017 Jahr
Kennzahlen der Wertänderungen vom Jahr zum Jahr
im Durchschnitt:
378.158 Tsnd.
Minimum:
-250.0 Tsnd.
1 Jan 1992 Jahr
Maximum:
1.43 Mln.
1 Jan 2010 Jahr
Zum Datum der Beobachtung
Wert
Absolute Veränderung
Die Veränderung bezüglich dem vorherigen Wert
1 Jan 1973 Jahr
10.0 Tsnd.
+10.0 Tsnd.
0.0%
1 Jan 1975 Jahr
20.0 Tsnd.
+10.0 Tsnd.
100.0%
1 Jan 1977 Jahr
30.0 Tsnd.
+10.0 Tsnd.
50.0%
1 Jan 1978 Jahr
30.0 Tsnd.
0.0
0.0%
1 Jan 1979 Jahr
10.0 Tsnd.
-20.0 Tsnd.
-66.67%
1 Jan 1982 Jahr
10.0 Tsnd.
0.0
0.0%
1 Jan 1984 Jahr
1000.0 Tsnd.
+990.0 Tsnd.
9.9 Tsnd.%
1 Jan 1985 Jahr
110.0 Tsnd.
-890.0 Tsnd.
-89.0%
1 Jan 1986 Jahr
290.0 Tsnd.
+180.0 Tsnd.
163.64%
1 Jan 1987 Jahr
60.0 Tsnd.
-230.0 Tsnd.
-79.31%
1 Jan 1988 Jahr
240.0 Tsnd.
+180.0 Tsnd.
300.0%
1 Jan 1989 Jahr
510.0 Tsnd.
+270.0 Tsnd.
112.5%
1 Jan 1990 Jahr
320.0 Tsnd.
-190.0 Tsnd.
-37.25%
1 Jan 1991 Jahr
400.0 Tsnd.
+80.0 Tsnd.
25.0%
1 Jan 1992 Jahr
-250.0 Tsnd.
-650.0 Tsnd.
-162.5%
1 Jan 1993 Jahr
270.0 Tsnd.
+520.0 Tsnd.
-208.0%
1 Jan 1994 Jahr
110.0 Tsnd.
-160.0 Tsnd.
-59.26%
1 Jan 1995 Jahr
30.0 Tsnd.
-80.0 Tsnd.
-72.73%
1 Jan 1996 Jahr
110.0 Tsnd.
+80.0 Tsnd.
266.67%
1 Jan 1997 Jahr
110.0 Tsnd.
0.0
0.0%
1 Jan 1998 Jahr
50.0 Tsnd.
-60.0 Tsnd.
-54.55%
1 Jan 1999 Jahr
170.0 Tsnd.
+120.0 Tsnd.
240.0%
1 Jan 2000 Jahr
90.0 Tsnd.
-80.0 Tsnd.
-47.06%
1 Jan 2001 Jahr
240.0 Tsnd.
+150.0 Tsnd.
166.67%
1 Jan 2002 Jahr
230.0 Tsnd.
-10.0 Tsnd.
-4.17%
1 Jan 2003 Jahr
290.0 Tsnd.
+60.0 Tsnd.
26.09%
1 Jan 2004 Jahr
600.0 Tsnd.
+310.0 Tsnd.
106.9%
1 Jan 2005 Jahr
610.0 Tsnd.
+10.0 Tsnd.
1.67%
1 Jan 2006 Jahr
710.0 Tsnd.
+100.0 Tsnd.
16.39%
1 Jan 2007 Jahr
1.08 Mln.
+370.0 Tsnd.
52.11%
1 Jan 2008 Jahr
600.0 Tsnd.
-480.0 Tsnd.
-44.44%
1 Jan 2009 Jahr
1.22 Mln.
+620.0 Tsnd.
103.33%
1 Jan 2010 Jahr
1.43 Mln.
+210.0 Tsnd.
17.21%
1 Jan 2011 Jahr
900.0 Tsnd.
-530.0 Tsnd.
-37.06%
1 Jan 2012 Jahr
1.04 Mln.
+140.0 Tsnd.
15.56%
1 Jan 2013 Jahr
500.0 Tsnd.
-540.0 Tsnd.
-51.92%
1 Jan 2014 Jahr
650.0 Tsnd.
+150.0 Tsnd.
30.0%
1 Jan 2015 Jahr
540.0 Tsnd.
-110.0 Tsnd.
-16.92%
Bewertung der Länder gemäß mit laufender Statistik nach Jahren


Kommentare: