29
/de/
de
AIzaSyAYiBZKx7MnpbEhh9jyipgxe19OcubqV5w
April 1, 2024
255158
Swaziland
SWZ
true
2
1
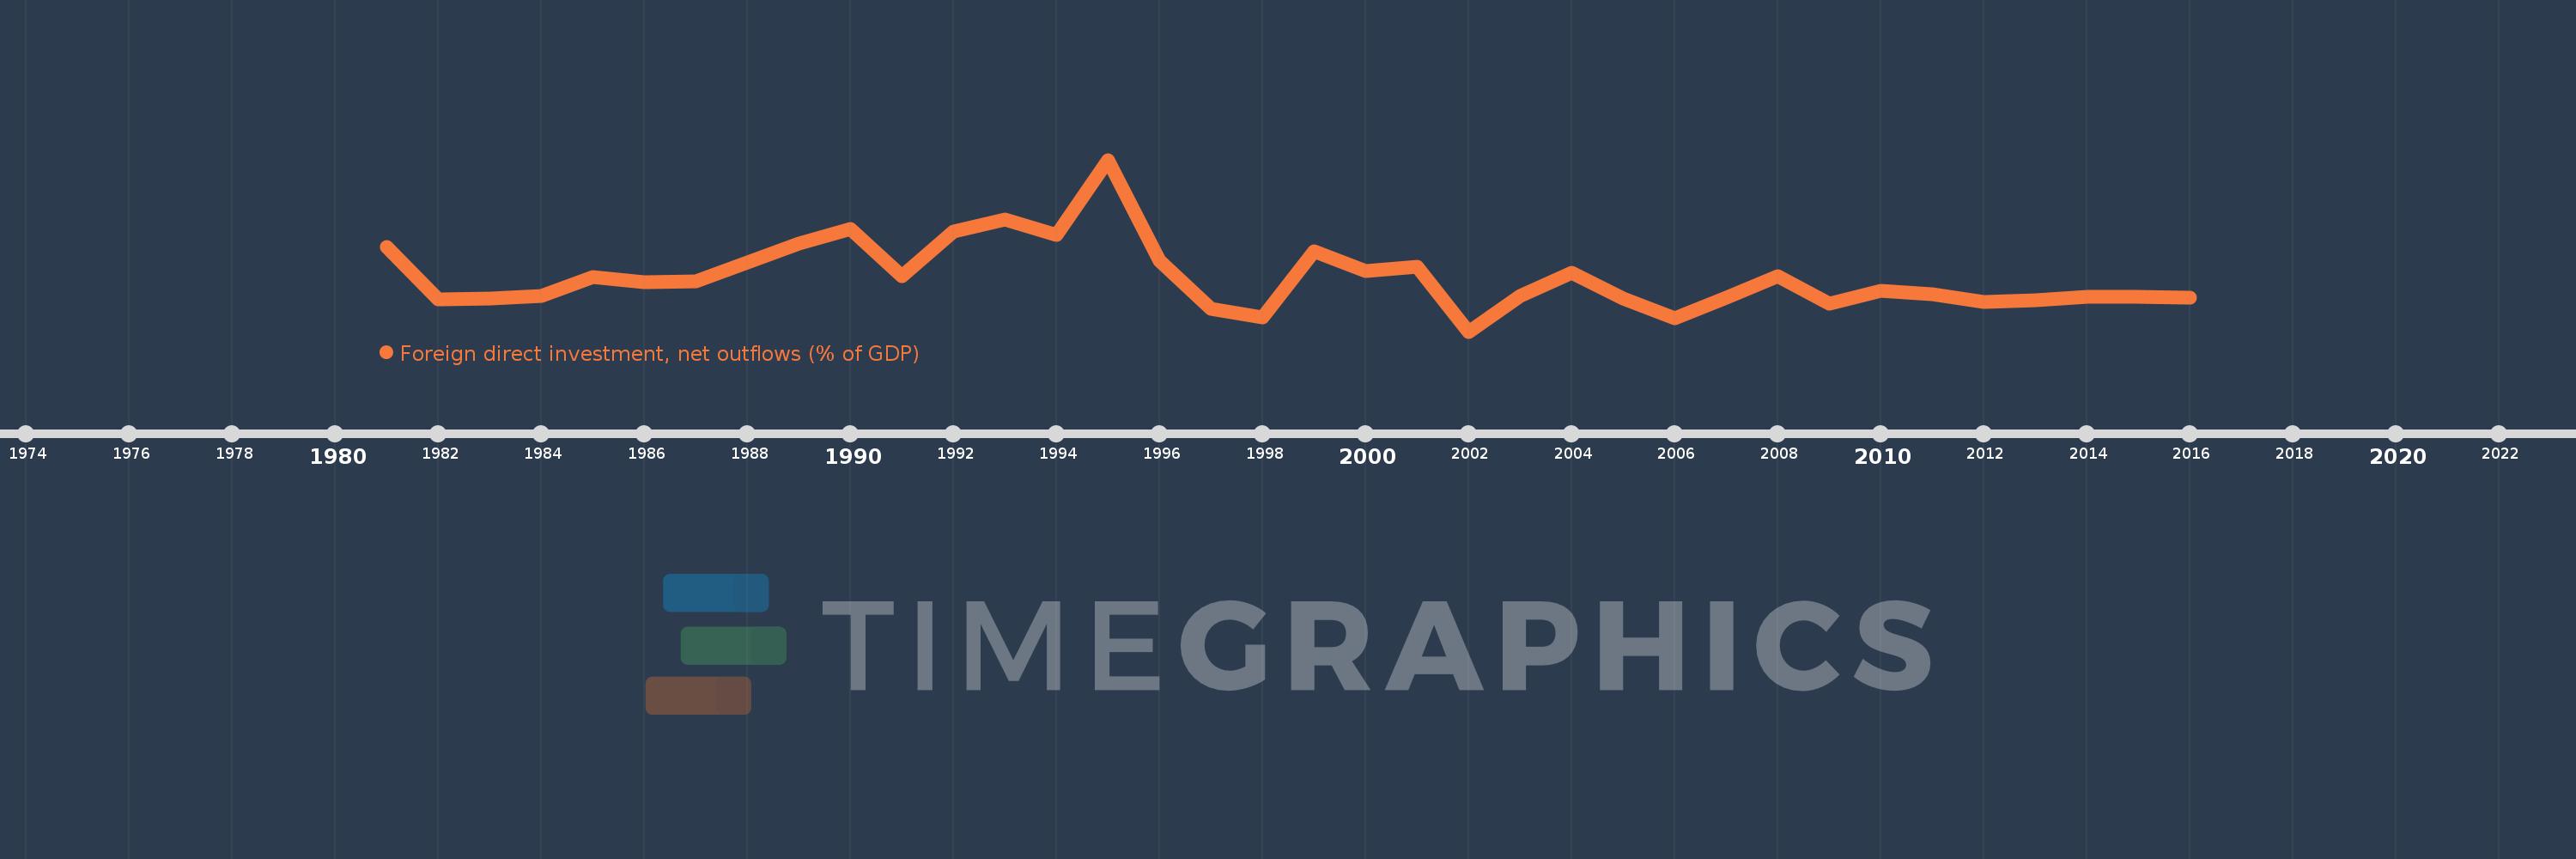
Foreign direct investment, net outflows (% of GDP)
2016,2015,2014,2013,2012,2011,2010,2009,2008,2007,2006,2005,2004,2003,2002,2001,2000,1999,1998,1997,1996,1995,1994,1993,1992,1991,1990,1989,1988,1987,1986,1985,1984,1983,1982,1981
Diese Statistik in anderen Ländern:
AfghanistanAlbaniaAlgeriaAngolaAntigua and BarbudaArab WorldArgentinaArmeniaArubaAustraliaAustriaAzerbaijanBahamas, TheBahrainBangladeshBarbadosBelarusBelgiumBelizeBeninBermudaBoliviaBosnia and HerzegovinaBotswanaBrazilBrunei DarussalamBulgariaBurkina FasoBurundiCabo VerdeCambodiaCameroonCanadaCaribbean small statesCayman IslandsCentral African RepublicCentral Europe and the BalticsChadChileChinaColombiaComorosCongo, Dem. Rep.Congo, Rep.Costa RicaCote d'IvoireCroatiaCyprusCzech RepublicDenmarkDominicaDominican RepublicEarly-demographic dividendEast Asia & PacificEast Asia & Pacific (excluding high income)East Asia & Pacific (IDA & IBRD countries)EcuadorEgypt, Arab Rep.El SalvadorEquatorial GuineaEritreaEstoniaEuro areaEurope & Central AsiaEurope & Central Asia (excluding high income)Europe & Central Asia (IDA & IBRD countries)European UnionFijiFinlandFragile and conflict affected situationsFranceFrench PolynesiaGabonGambia, TheGeorgiaGermanyGhanaGreeceGrenadaGuatemalaGuineaGuinea-BissauGuyanaHaitiHeavily indebted poor countries (HIPC)High incomeHondurasHong Kong SAR, ChinaHungaryIBRD onlyIcelandIDA & IBRD totalIDA blendIDA onlyIDA totalIndiaIndonesiaIran, Islamic Rep.IraqIrelandIsraelItalyJamaicaJapanJordanKazakhstanKenyaKiribatiKorea, Rep.KosovoKuwaitKyrgyz RepublicLao PDRLate-demographic dividendLatin America & Caribbean Latin America & Caribbean (excluding high income)Latin America & the Caribbean (IDA & IBRD countries)LatviaLeast developed countries: UN classificationLebanonLesothoLiberiaLibyaLithuaniaLow & middle incomeLow incomeLower middle incomeLuxembourgMacao SAR, ChinaMacedonia, FYRMadagascarMalawiMalaysiaMaliMaltaMarshall IslandsMauritaniaMauritiusMexicoMicronesia, Fed. Sts.Middle East & North AfricaMiddle East & North Africa (excluding high income)Middle East & North Africa (IDA & IBRD countries)Middle incomeMoldovaMongoliaMontenegroMoroccoMozambiqueNamibiaNauruNetherlandsNew ZealandNicaraguaNigerNigeriaNorth AmericaNorwayOECD membersOmanOther small statesPacific island small statesPakistanPalauPanamaPapua New GuineaParaguayPeruPhilippinesPolandPortugalPost-demographic dividendPre-demographic dividendQatarRomaniaRussian FederationRwandaSamoaSao Tome and PrincipeSaudi ArabiaSenegalSerbiaSeychellesSierra LeoneSingaporeSlovak RepublicSloveniaSmall statesSolomon IslandsSouth AfricaSouth AsiaSouth Asia (IDA & IBRD)SpainSri LankaSt. Kitts and NevisSt. LuciaSt. Vincent and the GrenadinesSub-Saharan Africa Sub-Saharan Africa (excluding high income)Sub-Saharan Africa (IDA & IBRD countries)SurinameSwazilandSwedenSwitzerlandSyrian Arab RepublicTajikistanTanzaniaThailandTimor-LesteTogoTongaTrinidad and TobagoTunisiaTurkeyUgandaUkraineUnited Arab EmiratesUnited KingdomUnited StatesUpper middle incomeUruguayVanuatuVenezuela, RBVietnamWest Bank and GazaWorldYemen, Rep.ZambiaZimbabwe Zeitlinie:
Diese Zeitleiste vorliegt die Graphik ab 1981 J. bis 2016 J. Swaziland. Die Angaben bis 1980 J. sind nicht vorhanden. Die Zahl aktueller Beobachtungen nach Daten: 36.
Die Quelle (Bezeichnung):
Kennzahlen der Weltentwicklung
Die Quelle (Einrichtung):
International Monetary Fund, International Financial Statistics and Balance of Payments databases, World Bank, International Debt Statistics, and World Bank and OECD GDP estimates.
Kategorien:
Economy & Growth, Financial Sector
Es wurde aktualisiert:
23 Apr 2017 Jahr
Kennzahlen der Wertänderungen vom Jahr zum Jahr
Minimum:
-1.161
1 Jan 2002 Jahr
Maximum:
4.558
1 Jan 1995 Jahr
Zum Datum der Beobachtung
Wert
Absolute Veränderung
Die Veränderung bezüglich dem vorherigen Wert
1 Jan 1981 Jahr
1.658
+1.658
0.0%
1 Jan 1982 Jahr
-0.1
-1.758
-106.02%
1 Jan 1983 Jahr
-0.051
+0.048
-48.51%
1 Jan 1984 Jahr
0.016
+0.068
-131.45%
1 Jan 1985 Jahr
0.658
+0.642
3.97 Tsnd.%
1 Jan 1986 Jahr
0.474
-0.184
-28.04%
1 Jan 1987 Jahr
0.507
+0.033
7.0%
1 Jan 1988 Jahr
1.144
+0.637
125.69%
1 Jan 1989 Jahr
1.773
+0.63
55.08%
1 Jan 1990 Jahr
2.243
+0.47
26.49%
1 Jan 1991 Jahr
0.683
-1.56
-69.55%
1 Jan 1992 Jahr
2.164
+1.481
216.88%
1 Jan 1993 Jahr
2.582
+0.417
19.28%
1 Jan 1994 Jahr
2.047
-0.535
-20.72%
1 Jan 1995 Jahr
4.558
+2.511
122.68%
1 Jan 1996 Jahr
1.212
-3.346
-73.41%
1 Jan 1997 Jahr
-0.402
-1.614
-133.18%
1 Jan 1998 Jahr
-0.698
-0.296
73.59%
1 Jan 1999 Jahr
1.517
+2.215
-317.23%
1 Jan 2000 Jahr
0.855
-0.662
-43.61%
1 Jan 2001 Jahr
1.001
+0.146
17.08%
1 Jan 2002 Jahr
-1.161
-2.162
-215.94%
1 Jan 2003 Jahr
0.023
+1.184
-102.0%
1 Jan 2004 Jahr
0.787
+0.763
3.29 Tsnd.%
1 Jan 2005 Jahr
-0.052
-0.839
-106.66%
1 Jan 2006 Jahr
-0.709
-0.657
1.25 Tsnd.%
1 Jan 2007 Jahr
-0.019
+0.69
-97.27%
1 Jan 2008 Jahr
0.689
+0.708
-3.66 Tsnd.%
1 Jan 2009 Jahr
-0.245
-0.934
-135.57%
1 Jan 2010 Jahr
0.196
+0.441
-180.09%
1 Jan 2011 Jahr
0.086
-0.11
-56.02%
1 Jan 2012 Jahr
-0.182
-0.268
-310.41%
1 Jan 2013 Jahr
-0.131
+0.05
-27.65%
1 Jan 2014 Jahr
0.007
+0.138
-105.31%
1 Jan 2015 Jahr
0.011
+0.005
64.77%
1 Jan 2016 Jahr
-0.03
-0.041
-358.21%
Bewertung der Länder gemäß mit laufender Statistik nach Jahren


Kommentare: