29
/de/
de
AIzaSyAYiBZKx7MnpbEhh9jyipgxe19OcubqV5w
April 1, 2024
214293
Norway
NOR
true
2
1
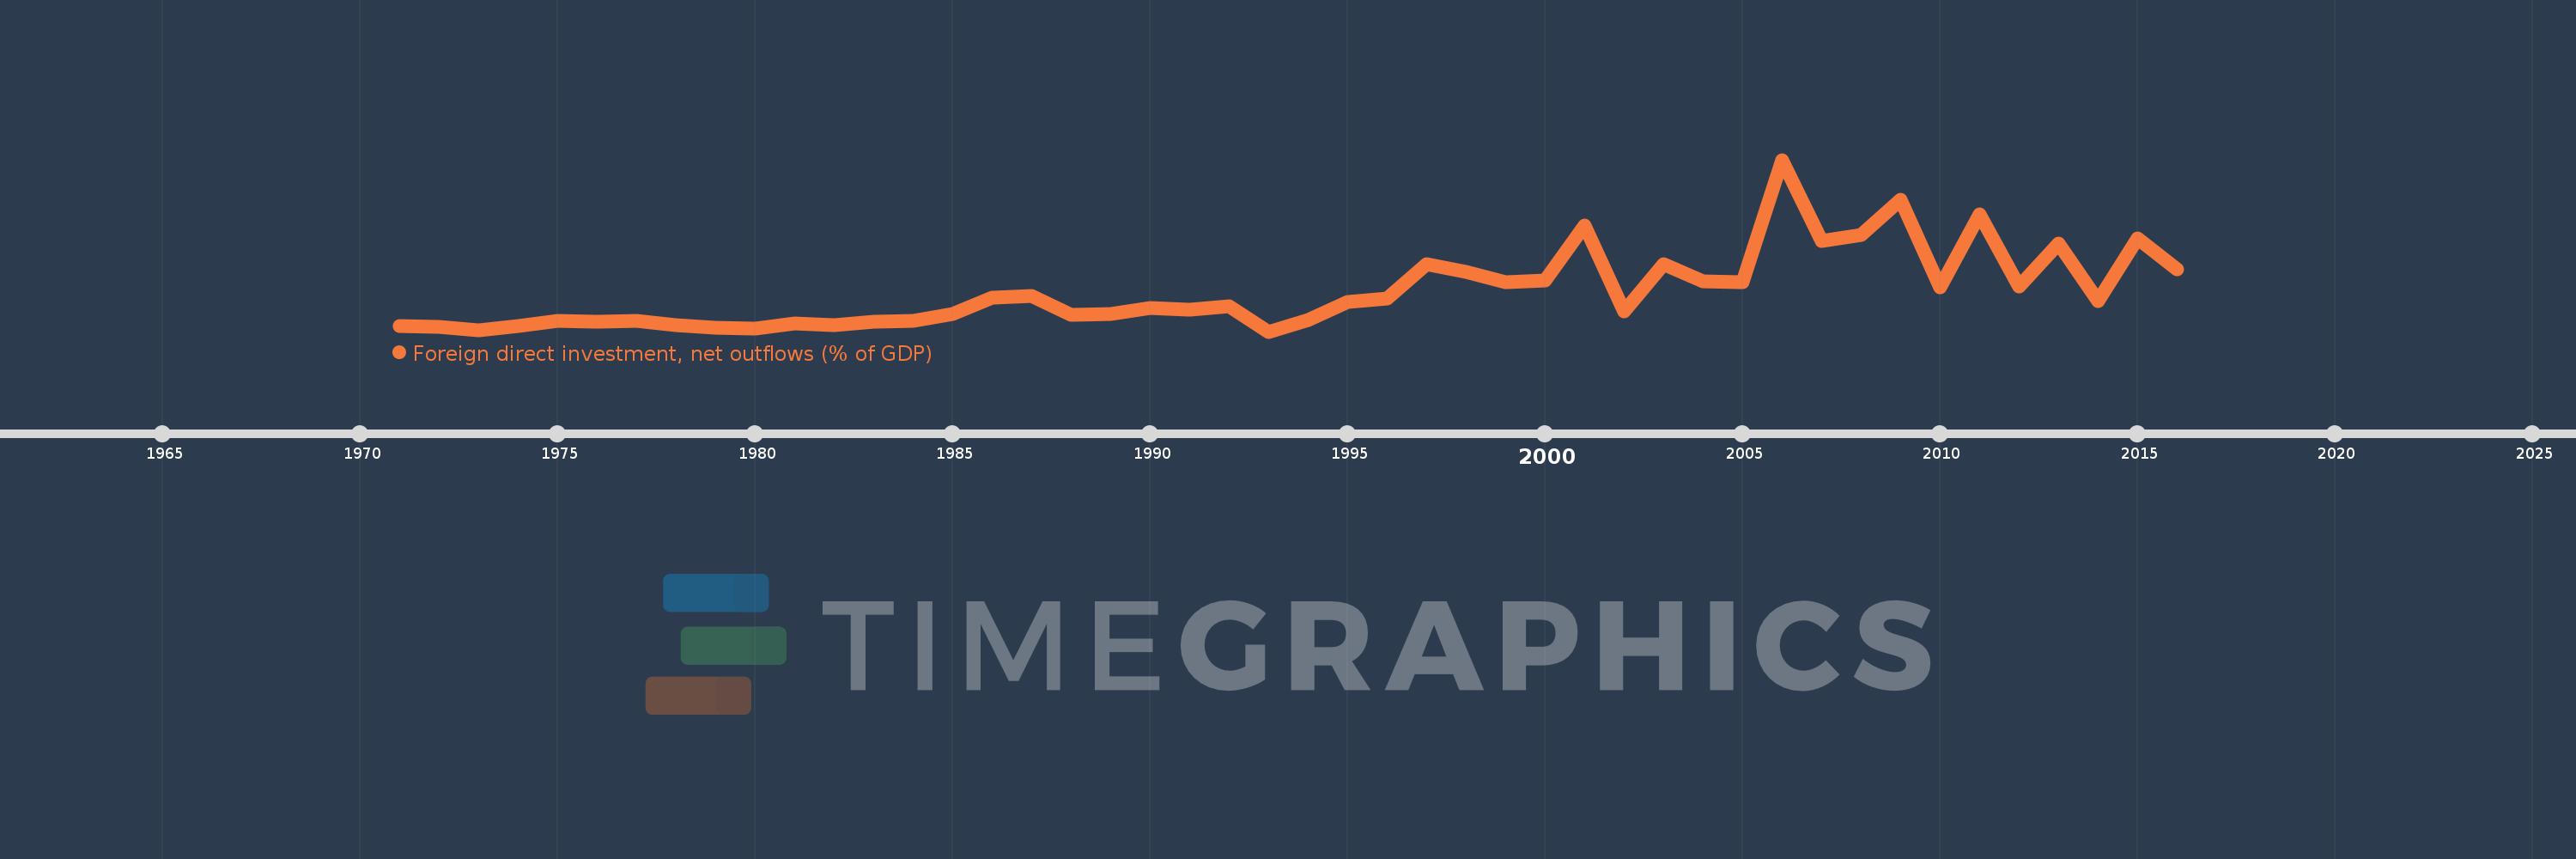
Foreign direct investment, net outflows (% of GDP)
2016,2015,2014,2013,2012,2011,2010,2009,2008,2007,2006,2005,2004,2003,2002,2001,2000,1999,1998,1997,1996,1995,1994,1993,1992,1991,1990,1989,1988,1987,1986,1985,1984,1983,1982,1981,1980,1979,1978,1977,1976,1975,1974,1973,1972,1971
Diese Statistik in anderen Ländern:
AfghanistanAlbaniaAlgeriaAngolaAntigua and BarbudaArab WorldArgentinaArmeniaArubaAustraliaAustriaAzerbaijanBahamas, TheBahrainBangladeshBarbadosBelarusBelgiumBelizeBeninBermudaBoliviaBosnia and HerzegovinaBotswanaBrazilBrunei DarussalamBulgariaBurkina FasoBurundiCabo VerdeCambodiaCameroonCanadaCaribbean small statesCayman IslandsCentral African RepublicCentral Europe and the BalticsChadChileChinaColombiaComorosCongo, Dem. Rep.Congo, Rep.Costa RicaCote d'IvoireCroatiaCyprusCzech RepublicDenmarkDominicaDominican RepublicEarly-demographic dividendEast Asia & PacificEast Asia & Pacific (excluding high income)East Asia & Pacific (IDA & IBRD countries)EcuadorEgypt, Arab Rep.El SalvadorEquatorial GuineaEritreaEstoniaEuro areaEurope & Central AsiaEurope & Central Asia (excluding high income)Europe & Central Asia (IDA & IBRD countries)European UnionFijiFinlandFragile and conflict affected situationsFranceFrench PolynesiaGabonGambia, TheGeorgiaGermanyGhanaGreeceGrenadaGuatemalaGuineaGuinea-BissauGuyanaHaitiHeavily indebted poor countries (HIPC)High incomeHondurasHong Kong SAR, ChinaHungaryIBRD onlyIcelandIDA & IBRD totalIDA blendIDA onlyIDA totalIndiaIndonesiaIran, Islamic Rep.IraqIrelandIsraelItalyJamaicaJapanJordanKazakhstanKenyaKiribatiKorea, Rep.KosovoKuwaitKyrgyz RepublicLao PDRLate-demographic dividendLatin America & Caribbean Latin America & Caribbean (excluding high income)Latin America & the Caribbean (IDA & IBRD countries)LatviaLeast developed countries: UN classificationLebanonLesothoLiberiaLibyaLithuaniaLow & middle incomeLow incomeLower middle incomeLuxembourgMacao SAR, ChinaMacedonia, FYRMadagascarMalawiMalaysiaMaliMaltaMarshall IslandsMauritaniaMauritiusMexicoMicronesia, Fed. Sts.Middle East & North AfricaMiddle East & North Africa (excluding high income)Middle East & North Africa (IDA & IBRD countries)Middle incomeMoldovaMongoliaMontenegroMoroccoMozambiqueNamibiaNauruNetherlandsNew ZealandNicaraguaNigerNigeriaNorth AmericaNorwayOECD membersOmanOther small statesPacific island small statesPakistanPalauPanamaPapua New GuineaParaguayPeruPhilippinesPolandPortugalPost-demographic dividendPre-demographic dividendQatarRomaniaRussian FederationRwandaSamoaSao Tome and PrincipeSaudi ArabiaSenegalSerbiaSeychellesSierra LeoneSingaporeSlovak RepublicSloveniaSmall statesSolomon IslandsSouth AfricaSouth AsiaSouth Asia (IDA & IBRD)SpainSri LankaSt. Kitts and NevisSt. LuciaSt. Vincent and the GrenadinesSub-Saharan Africa Sub-Saharan Africa (excluding high income)Sub-Saharan Africa (IDA & IBRD countries)SurinameSwazilandSwedenSwitzerlandSyrian Arab RepublicTajikistanTanzaniaThailandTimor-LesteTogoTongaTrinidad and TobagoTunisiaTurkeyUgandaUkraineUnited Arab EmiratesUnited KingdomUnited StatesUpper middle incomeUruguayVanuatuVenezuela, RBVietnamWest Bank and GazaWorldYemen, Rep.ZambiaZimbabwe Zeitlinie:
Diese Zeitleiste vorliegt die Graphik ab 1971 J. bis 2016 J. Norway. Die Angaben bis 1970 J. sind nicht vorhanden. Die Zahl aktueller Beobachtungen nach Daten: 46.
Die Quelle (Bezeichnung):
Kennzahlen der Weltentwicklung
Die Quelle (Einrichtung):
International Monetary Fund, International Financial Statistics and Balance of Payments databases, World Bank, International Debt Statistics, and World Bank and OECD GDP estimates.
Kategorien:
Economy & Growth, Financial Sector
Es wurde aktualisiert:
23 Apr 2017 Jahr
Kennzahlen der Wertänderungen vom Jahr zum Jahr
Minimum:
-0.092
1 Jan 1993 Jahr
Maximum:
10.279
1 Jan 2006 Jahr
Zum Datum der Beobachtung
Wert
Absolute Veränderung
Die Veränderung bezüglich dem vorherigen Wert
1 Jan 1971 Jahr
0.25
+0.25
0.0%
1 Jan 1972 Jahr
0.219
-0.03
-12.13%
1 Jan 1973 Jahr
0.0
-0.219
-100.0%
1 Jan 1974 Jahr
0.222
+0.222
%
1 Jan 1975 Jahr
0.545
+0.323
145.72%
1 Jan 1976 Jahr
0.522
-0.024
-4.31%
1 Jan 1977 Jahr
0.536
+0.014
2.77%
1 Jan 1978 Jahr
0.301
-0.235
-43.79%
1 Jan 1979 Jahr
0.141
-0.16
-53.11%
1 Jan 1980 Jahr
0.082
-0.059
-41.85%
1 Jan 1981 Jahr
0.393
+0.311
378.25%
1 Jan 1982 Jahr
0.283
-0.109
-27.86%
1 Jan 1983 Jahr
0.483
+0.199
70.33%
1 Jan 1984 Jahr
0.581
+0.099
20.42%
1 Jan 1985 Jahr
0.972
+0.391
67.26%
1 Jan 1986 Jahr
1.977
+1.004
103.28%
1 Jan 1987 Jahr
2.037
+0.06
3.05%
1 Jan 1988 Jahr
0.931
-1.106
-54.3%
1 Jan 1989 Jahr
0.95
+0.019
2.02%
1 Jan 1990 Jahr
1.311
+0.361
38.04%
1 Jan 1991 Jahr
1.224
-0.087
-6.62%
1 Jan 1992 Jahr
1.463
+0.239
19.5%
1 Jan 1993 Jahr
-0.092
-1.555
-106.28%
1 Jan 1994 Jahr
0.596
+0.688
-748.45%
1 Jan 1995 Jahr
1.704
+1.108
185.95%
1 Jan 1996 Jahr
1.881
+0.177
10.4%
1 Jan 1997 Jahr
3.996
+2.115
112.47%
1 Jan 1998 Jahr
3.49
-0.506
-12.65%
1 Jan 1999 Jahr
2.914
-0.577
-16.53%
1 Jan 2000 Jahr
2.991
+0.077
2.65%
1 Jan 2001 Jahr
6.306
+3.315
110.85%
1 Jan 2002 Jahr
1.109
-5.196
-82.41%
1 Jan 2003 Jahr
3.961
+2.851
257.01%
1 Jan 2004 Jahr
2.921
-1.04
-26.25%
1 Jan 2005 Jahr
2.884
-0.037
-1.26%
1 Jan 2006 Jahr
10.279
+7.395
256.4%
1 Jan 2007 Jahr
5.362
-4.918
-47.84%
1 Jan 2008 Jahr
5.719
+0.357
6.65%
1 Jan 2009 Jahr
7.864
+2.145
37.51%
1 Jan 2010 Jahr
2.58
-5.284
-67.19%
1 Jan 2011 Jahr
6.987
+4.407
170.84%
1 Jan 2012 Jahr
2.609
-4.378
-62.66%
1 Jan 2013 Jahr
5.239
+2.63
100.8%
1 Jan 2014 Jahr
1.766
-3.473
-66.29%
1 Jan 2015 Jahr
5.516
+3.75
212.37%
1 Jan 2016 Jahr
3.69
-1.826
-33.1%
Bewertung der Länder gemäß mit laufender Statistik nach Jahren


Kommentare: