29
/de/
de
AIzaSyAYiBZKx7MnpbEhh9jyipgxe19OcubqV5w
April 1, 2024
249236
Sri Lanka
LKA
true
2
1
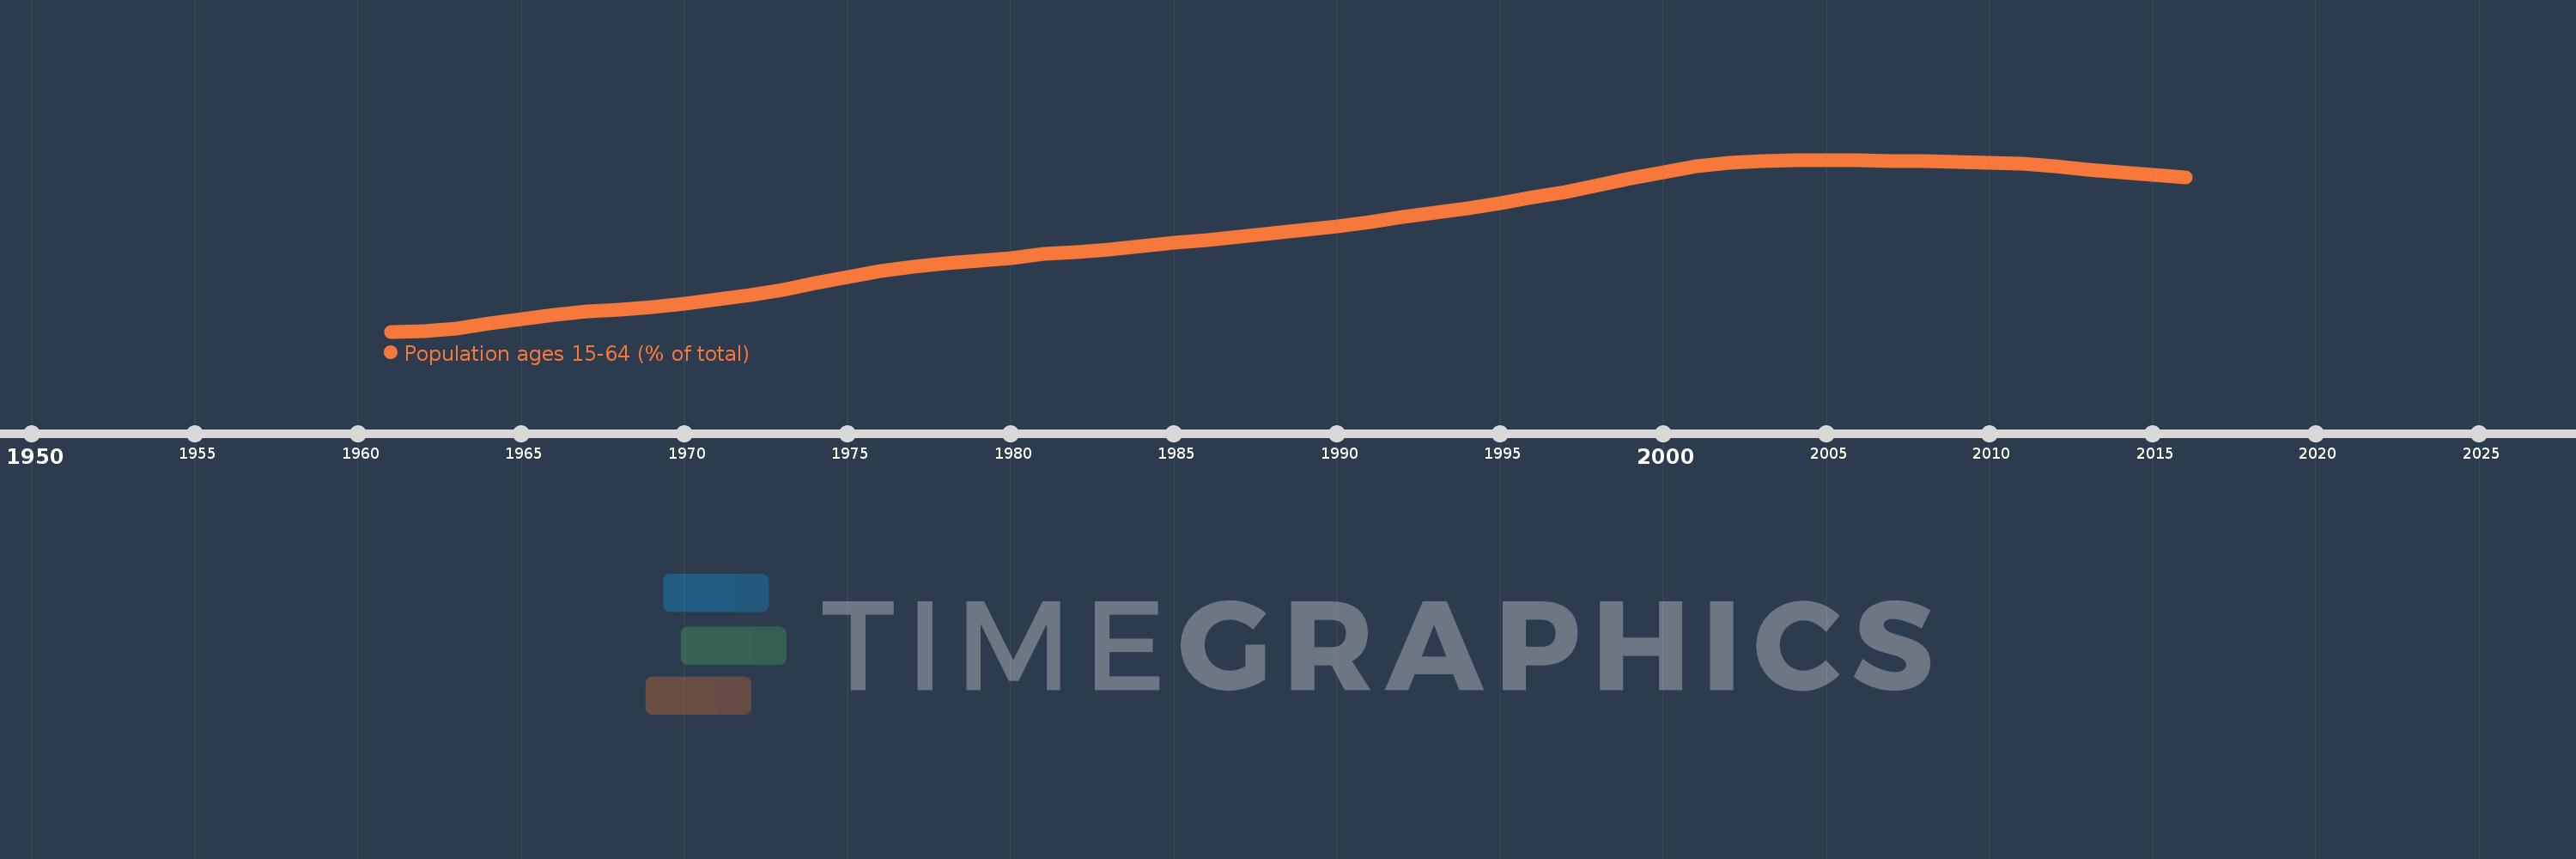
Population ages 15-64 (% of total)
2016,2015,2014,2013,2012,2011,2010,2009,2008,2007,2006,2005,2004,2003,2002,2001,2000,1999,1998,1997,1996,1995,1994,1993,1992,1991,1990,1989,1988,1987,1986,1985,1984,1983,1982,1981,1980,1979,1978,1977,1976,1975,1974,1973,1972,1971,1970,1969,1968,1967,1966,1965,1964,1963,1962,1961
Diese Statistik in anderen Ländern:
AfghanistanAlbaniaAlgeriaAngolaAntigua and BarbudaArab WorldArgentinaArmeniaArubaAustraliaAustriaAzerbaijanBahamas, TheBahrainBangladeshBarbadosBelarusBelgiumBelizeBeninBhutanBoliviaBosnia and HerzegovinaBotswanaBrazilBrunei DarussalamBulgariaBurkina FasoBurundiCabo VerdeCambodiaCameroonCanadaCaribbean small statesCentral African RepublicCentral Europe and the BalticsChadChannel IslandsChileChinaColombiaComorosCongo, Dem. Rep.Congo, Rep.Costa RicaCote d'IvoireCroatiaCubaCuracaoCyprusCzech RepublicDenmarkDjiboutiDominican RepublicEarly-demographic dividendEast Asia & PacificEast Asia & Pacific (excluding high income)East Asia & Pacific (IDA & IBRD countries)EcuadorEgypt, Arab Rep.El SalvadorEquatorial GuineaEritreaEstoniaEthiopiaEuro areaEurope & Central AsiaEurope & Central Asia (excluding high income)Europe & Central Asia (IDA & IBRD countries)European UnionFijiFinlandFragile and conflict affected situationsFranceFrench PolynesiaGabonGambia, TheGeorgiaGermanyGhanaGreeceGrenadaGuamGuatemalaGuineaGuinea-BissauGuyanaHaitiHeavily indebted poor countries (HIPC)High incomeHondurasHong Kong SAR, ChinaHungaryIBRD onlyIcelandIDA & IBRD totalIDA blendIDA onlyIDA totalIndiaIndonesiaIran, Islamic Rep.IraqIrelandIsraelItalyJamaicaJapanJordanKazakhstanKenyaKiribatiKorea, Dem. People’s Rep.Korea, Rep.KosovoKuwaitKyrgyz RepublicLao PDRLate-demographic dividendLatin America & Caribbean Latin America & Caribbean (excluding high income)Latin America & the Caribbean (IDA & IBRD countries)LatviaLeast developed countries: UN classificationLebanonLesothoLiberiaLibyaLithuaniaLow & middle incomeLow incomeLower middle incomeLuxembourgMacao SAR, ChinaMacedonia, FYRMadagascarMalawiMalaysiaMaldivesMaliMaltaMauritaniaMauritiusMexicoMicronesia, Fed. Sts.Middle East & North AfricaMiddle East & North Africa (excluding high income)Middle East & North Africa (IDA & IBRD countries)Middle incomeMoldovaMongoliaMontenegroMoroccoMozambiqueMyanmarNamibiaNepalNetherlandsNew CaledoniaNew ZealandNicaraguaNigerNigeriaNorth AmericaNorwayOECD membersOmanOther small statesPacific island small statesPakistanPanamaPapua New GuineaParaguayPeruPhilippinesPolandPortugalPost-demographic dividendPre-demographic dividendPuerto RicoQatarRomaniaRussian FederationRwandaSamoaSao Tome and PrincipeSaudi ArabiaSenegalSerbiaSeychellesSierra LeoneSingaporeSlovak RepublicSloveniaSmall statesSolomon IslandsSomaliaSouth AfricaSouth AsiaSouth Asia (IDA & IBRD)South SudanSpainSri LankaSt. LuciaSt. Vincent and the GrenadinesSub-Saharan Africa Sub-Saharan Africa (excluding high income)Sub-Saharan Africa (IDA & IBRD countries)SudanSurinameSwazilandSwedenSwitzerlandSyrian Arab RepublicTajikistanTanzaniaThailandTimor-LesteTogoTongaTrinidad and TobagoTunisiaTurkeyTurkmenistanUgandaUkraineUnited Arab EmiratesUnited KingdomUnited StatesUpper middle incomeUruguayUzbekistanVanuatuVenezuela, RBVietnamVirgin Islands (U.S.)West Bank and GazaWorldYemen, Rep.ZambiaZimbabwe Zeitlinie:
Diese Zeitleiste vorliegt die Graphik ab 1961 J. bis 2016 J. Sri Lanka. Die Angaben bis 1960 J. sind nicht vorhanden. Die Zahl aktueller Beobachtungen nach Daten: 56.
Die Quelle (Bezeichnung):
Kennzahlen der Weltentwicklung
Die Quelle (Einrichtung):
World Bank staff estimates based on age distributions of United Nations Population Division's World Population Prospects.
Kategorien:
Education, Health
Es wurde aktualisiert:
23 Apr 2017 Jahr
Kennzahlen der Wertänderungen vom Jahr zum Jahr
Minimum:
53.33
1 Jan 1961 Jahr
Maximum:
67.56
1 Jan 2006 Jahr
Zum Datum der Beobachtung
Wert
Absolute Veränderung
Die Veränderung bezüglich dem vorherigen Wert
1 Jan 1961 Jahr
53.33
+53.33
0.0%
1 Jan 1962 Jahr
53.357
+0.027
0.05%
1 Jan 1963 Jahr
53.611
+0.254
0.48%
1 Jan 1964 Jahr
53.997
+0.386
0.72%
1 Jan 1965 Jahr
54.379
+0.382
0.71%
1 Jan 1966 Jahr
54.696
+0.317
0.58%
1 Jan 1967 Jahr
54.982
+0.287
0.52%
1 Jan 1968 Jahr
55.178
+0.196
0.36%
1 Jan 1969 Jahr
55.353
+0.175
0.32%
1 Jan 1970 Jahr
55.62
+0.267
0.48%
1 Jan 1971 Jahr
56.028
+0.408
0.73%
1 Jan 1972 Jahr
56.328
+0.3
0.54%
1 Jan 1973 Jahr
56.788
+0.46
0.82%
1 Jan 1974 Jahr
57.338
+0.55
0.97%
1 Jan 1975 Jahr
57.865
+0.528
0.92%
1 Jan 1976 Jahr
58.313
+0.447
0.77%
1 Jan 1977 Jahr
58.704
+0.392
0.67%
1 Jan 1978 Jahr
58.983
+0.278
0.47%
1 Jan 1979 Jahr
59.201
+0.218
0.37%
1 Jan 1980 Jahr
59.442
+0.241
0.41%
1 Jan 1981 Jahr
59.741
+0.299
0.5%
1 Jan 1982 Jahr
59.89
+0.148
0.25%
1 Jan 1983 Jahr
60.121
+0.231
0.39%
1 Jan 1984 Jahr
60.397
+0.276
0.46%
1 Jan 1985 Jahr
60.665
+0.268
0.44%
1 Jan 1986 Jahr
60.906
+0.241
0.4%
1 Jan 1987 Jahr
61.173
+0.268
0.44%
1 Jan 1988 Jahr
61.456
+0.282
0.46%
1 Jan 1989 Jahr
61.754
+0.299
0.49%
1 Jan 1990 Jahr
62.076
+0.322
0.52%
1 Jan 1991 Jahr
62.423
+0.346
0.56%
1 Jan 1992 Jahr
62.829
+0.407
0.65%
1 Jan 1993 Jahr
63.2
+0.37
0.59%
1 Jan 1994 Jahr
63.567
+0.368
0.58%
1 Jan 1995 Jahr
63.977
+0.409
0.64%
1 Jan 1996 Jahr
64.446
+0.469
0.73%
1 Jan 1997 Jahr
64.899
+0.453
0.7%
1 Jan 1998 Jahr
65.432
+0.534
0.82%
1 Jan 1999 Jahr
66.011
+0.579
0.88%
1 Jan 2000 Jahr
66.559
+0.548
0.83%
1 Jan 2001 Jahr
67.021
+0.462
0.69%
1 Jan 2002 Jahr
67.276
+0.255
0.38%
1 Jan 2003 Jahr
67.43
+0.154
0.23%
1 Jan 2004 Jahr
67.503
+0.074
0.11%
1 Jan 2005 Jahr
67.54
+0.036
0.05%
1 Jan 2006 Jahr
67.56
+0.021
0.03%
1 Jan 2007 Jahr
67.484
-0.076
-0.11%
1 Jan 2008 Jahr
67.434
-0.05
-0.07%
1 Jan 2009 Jahr
67.394
-0.04
-0.06%
1 Jan 2010 Jahr
67.336
-0.058
-0.09%
1 Jan 2011 Jahr
67.244
-0.092
-0.14%
1 Jan 2012 Jahr
67.022
-0.222
-0.33%
1 Jan 2013 Jahr
66.775
-0.248
-0.37%
1 Jan 2014 Jahr
66.526
-0.249
-0.37%
1 Jan 2015 Jahr
66.304
-0.222
-0.33%
1 Jan 2016 Jahr
66.123
-0.181
-0.27%
Bewertung der Länder gemäß mit laufender Statistik nach Jahren


Kommentare: