29
/de/
de
AIzaSyAYiBZKx7MnpbEhh9jyipgxe19OcubqV5w
April 1, 2024
168943
Kiribati
KIR
true
2
1
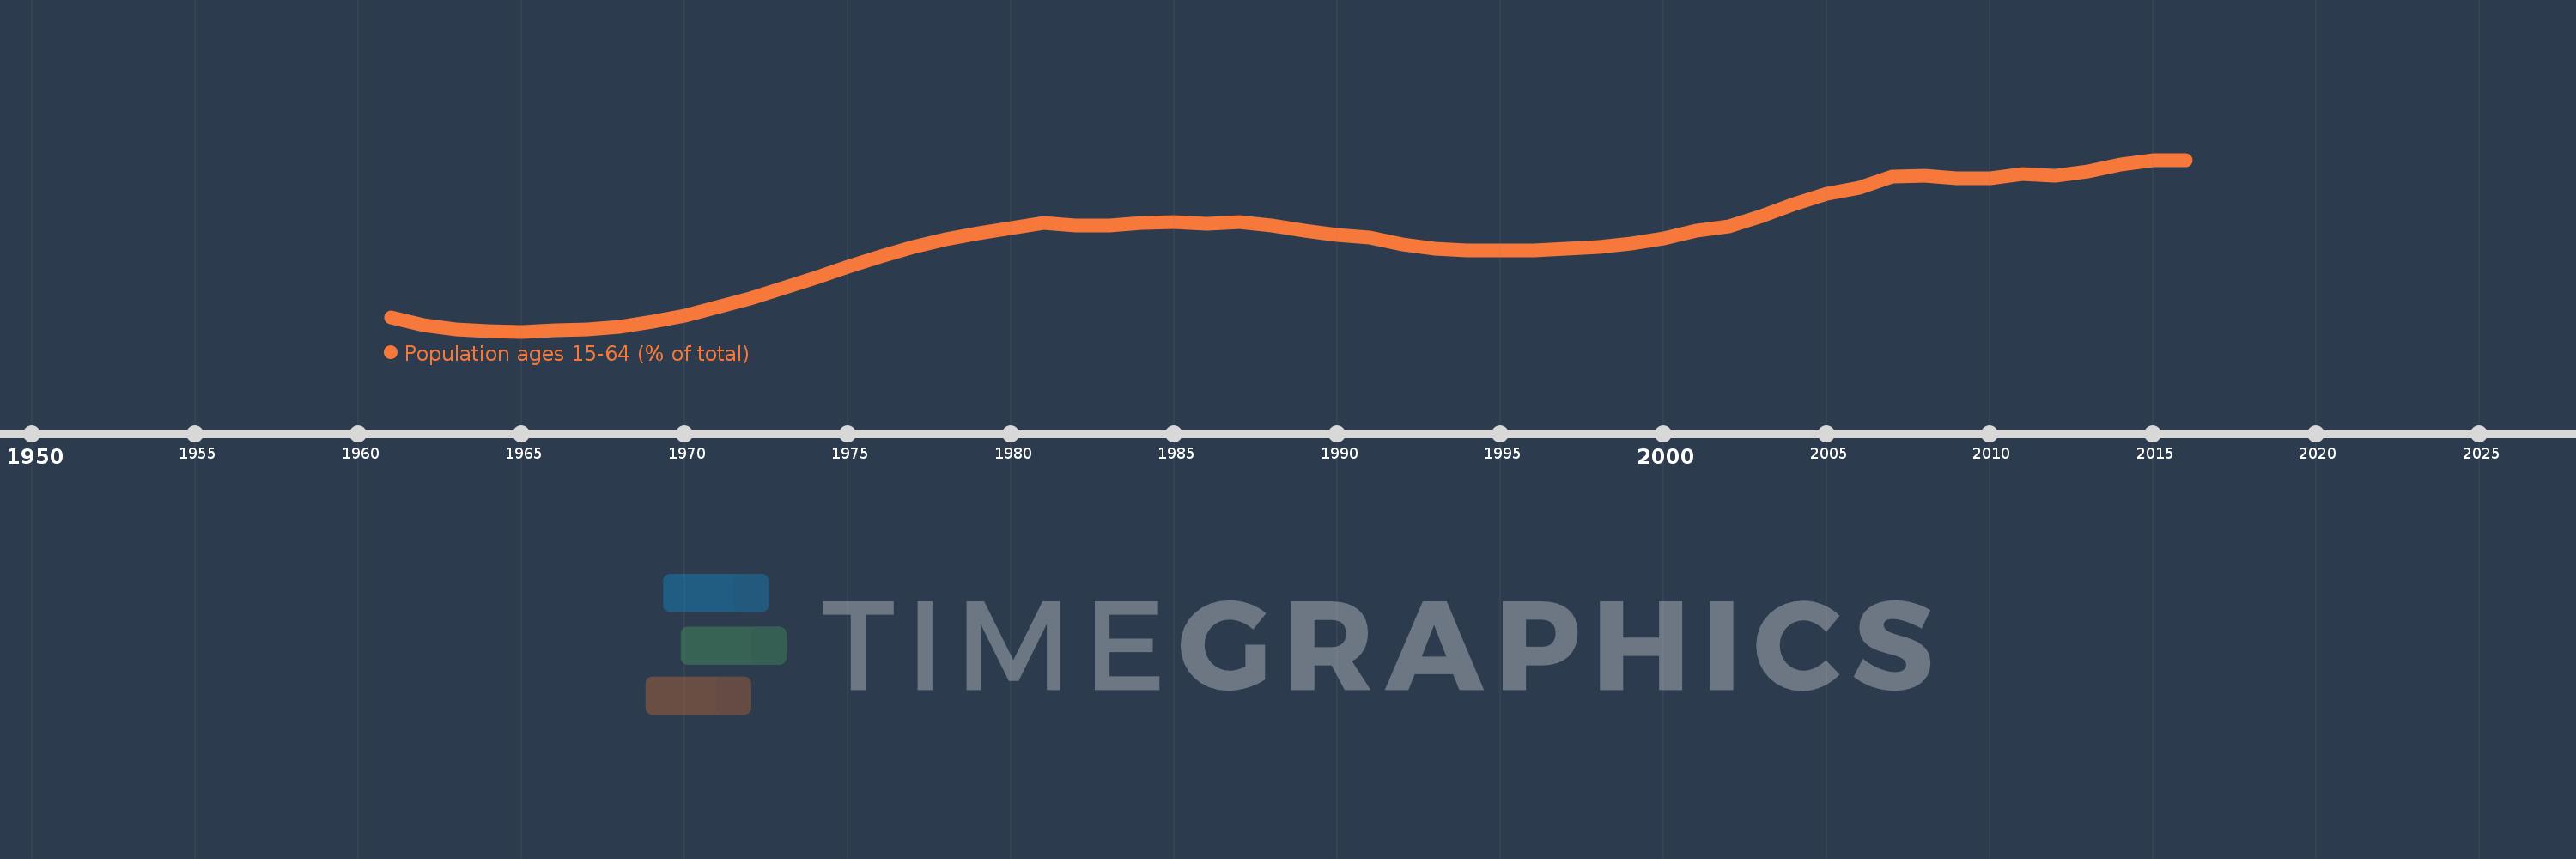
Population ages 15-64 (% of total)
2016,2015,2014,2013,2012,2011,2010,2009,2008,2007,2006,2005,2004,2003,2002,2001,2000,1999,1998,1997,1996,1995,1994,1993,1992,1991,1990,1989,1988,1987,1986,1985,1984,1983,1982,1981,1980,1979,1978,1977,1976,1975,1974,1973,1972,1971,1970,1969,1968,1967,1966,1965,1964,1963,1962,1961
Diese Statistik in anderen Ländern:
AfghanistanAlbaniaAlgeriaAngolaAntigua and BarbudaArab WorldArgentinaArmeniaArubaAustraliaAustriaAzerbaijanBahamas, TheBahrainBangladeshBarbadosBelarusBelgiumBelizeBeninBhutanBoliviaBosnia and HerzegovinaBotswanaBrazilBrunei DarussalamBulgariaBurkina FasoBurundiCabo VerdeCambodiaCameroonCanadaCaribbean small statesCentral African RepublicCentral Europe and the BalticsChadChannel IslandsChileChinaColombiaComorosCongo, Dem. Rep.Congo, Rep.Costa RicaCote d'IvoireCroatiaCubaCuracaoCyprusCzech RepublicDenmarkDjiboutiDominican RepublicEarly-demographic dividendEast Asia & PacificEast Asia & Pacific (excluding high income)East Asia & Pacific (IDA & IBRD countries)EcuadorEgypt, Arab Rep.El SalvadorEquatorial GuineaEritreaEstoniaEthiopiaEuro areaEurope & Central AsiaEurope & Central Asia (excluding high income)Europe & Central Asia (IDA & IBRD countries)European UnionFijiFinlandFragile and conflict affected situationsFranceFrench PolynesiaGabonGambia, TheGeorgiaGermanyGhanaGreeceGrenadaGuamGuatemalaGuineaGuinea-BissauGuyanaHaitiHeavily indebted poor countries (HIPC)High incomeHondurasHong Kong SAR, ChinaHungaryIBRD onlyIcelandIDA & IBRD totalIDA blendIDA onlyIDA totalIndiaIndonesiaIran, Islamic Rep.IraqIrelandIsraelItalyJamaicaJapanJordanKazakhstanKenyaKiribatiKorea, Dem. People’s Rep.Korea, Rep.KosovoKuwaitKyrgyz RepublicLao PDRLate-demographic dividendLatin America & Caribbean Latin America & Caribbean (excluding high income)Latin America & the Caribbean (IDA & IBRD countries)LatviaLeast developed countries: UN classificationLebanonLesothoLiberiaLibyaLithuaniaLow & middle incomeLow incomeLower middle incomeLuxembourgMacao SAR, ChinaMacedonia, FYRMadagascarMalawiMalaysiaMaldivesMaliMaltaMauritaniaMauritiusMexicoMicronesia, Fed. Sts.Middle East & North AfricaMiddle East & North Africa (excluding high income)Middle East & North Africa (IDA & IBRD countries)Middle incomeMoldovaMongoliaMontenegroMoroccoMozambiqueMyanmarNamibiaNepalNetherlandsNew CaledoniaNew ZealandNicaraguaNigerNigeriaNorth AmericaNorwayOECD membersOmanOther small statesPacific island small statesPakistanPanamaPapua New GuineaParaguayPeruPhilippinesPolandPortugalPost-demographic dividendPre-demographic dividendPuerto RicoQatarRomaniaRussian FederationRwandaSamoaSao Tome and PrincipeSaudi ArabiaSenegalSerbiaSeychellesSierra LeoneSingaporeSlovak RepublicSloveniaSmall statesSolomon IslandsSomaliaSouth AfricaSouth AsiaSouth Asia (IDA & IBRD)South SudanSpainSri LankaSt. LuciaSt. Vincent and the GrenadinesSub-Saharan Africa Sub-Saharan Africa (excluding high income)Sub-Saharan Africa (IDA & IBRD countries)SudanSurinameSwazilandSwedenSwitzerlandSyrian Arab RepublicTajikistanTanzaniaThailandTimor-LesteTogoTongaTrinidad and TobagoTunisiaTurkeyTurkmenistanUgandaUkraineUnited Arab EmiratesUnited KingdomUnited StatesUpper middle incomeUruguayUzbekistanVanuatuVenezuela, RBVietnamVirgin Islands (U.S.)West Bank and GazaWorldYemen, Rep.ZambiaZimbabwe Zeitlinie:
Diese Zeitleiste vorliegt die Graphik ab 1961 J. bis 2016 J. Kiribati. Die Angaben bis 1960 J. sind nicht vorhanden. Die Zahl aktueller Beobachtungen nach Daten: 56.
Die Quelle (Bezeichnung):
Kennzahlen der Weltentwicklung
Die Quelle (Einrichtung):
World Bank staff estimates based on age distributions of United Nations Population Division's World Population Prospects.
Kategorien:
Education, Health
Es wurde aktualisiert:
23 Apr 2017 Jahr
Kennzahlen der Wertänderungen vom Jahr zum Jahr
Minimum:
50.114
1 Jan 1965 Jahr
Maximum:
61.35
1 Jan 2016 Jahr
Zum Datum der Beobachtung
Wert
Absolute Veränderung
Die Veränderung bezüglich dem vorherigen Wert
1 Jan 1961 Jahr
51.036
+51.036
0.0%
1 Jan 1962 Jahr
50.543
-0.492
-0.97%
1 Jan 1963 Jahr
50.249
-0.294
-0.58%
1 Jan 1964 Jahr
50.124
-0.125
-0.25%
1 Jan 1965 Jahr
50.114
-0.009
-0.02%
1 Jan 1966 Jahr
50.199
+0.085
0.17%
1 Jan 1967 Jahr
50.252
+0.053
0.1%
1 Jan 1968 Jahr
50.436
+0.184
0.37%
1 Jan 1969 Jahr
50.742
+0.306
0.61%
1 Jan 1970 Jahr
51.168
+0.426
0.84%
1 Jan 1971 Jahr
51.699
+0.531
1.04%
1 Jan 1972 Jahr
52.303
+0.604
1.17%
1 Jan 1973 Jahr
52.956
+0.653
1.25%
1 Jan 1974 Jahr
53.642
+0.686
1.3%
1 Jan 1975 Jahr
54.343
+0.701
1.31%
1 Jan 1976 Jahr
55.029
+0.686
1.26%
1 Jan 1977 Jahr
55.663
+0.634
1.15%
1 Jan 1978 Jahr
56.152
+0.49
0.88%
1 Jan 1979 Jahr
56.538
+0.385
0.69%
1 Jan 1980 Jahr
56.882
+0.344
0.61%
1 Jan 1981 Jahr
57.228
+0.346
0.61%
1 Jan 1982 Jahr
57.041
-0.186
-0.33%
1 Jan 1983 Jahr
57.069
+0.027
0.05%
1 Jan 1984 Jahr
57.215
+0.147
0.26%
1 Jan 1985 Jahr
57.284
+0.069
0.12%
1 Jan 1986 Jahr
57.16
-0.124
-0.22%
1 Jan 1987 Jahr
57.252
+0.092
0.16%
1 Jan 1988 Jahr
57.063
-0.189
-0.33%
1 Jan 1989 Jahr
56.723
-0.34
-0.6%
1 Jan 1990 Jahr
56.436
-0.288
-0.51%
1 Jan 1991 Jahr
56.291
-0.144
-0.26%
1 Jan 1992 Jahr
55.84
-0.451
-0.8%
1 Jan 1993 Jahr
55.556
-0.284
-0.51%
1 Jan 1994 Jahr
55.434
-0.122
-0.22%
1 Jan 1995 Jahr
55.407
-0.027
-0.05%
1 Jan 1996 Jahr
55.418
+0.011
0.02%
1 Jan 1997 Jahr
55.531
+0.113
0.2%
1 Jan 1998 Jahr
55.652
+0.12
0.22%
1 Jan 1999 Jahr
55.849
+0.197
0.35%
1 Jan 2000 Jahr
56.205
+0.357
0.64%
1 Jan 2001 Jahr
56.716
+0.511
0.91%
1 Jan 2002 Jahr
57.015
+0.299
0.53%
1 Jan 2003 Jahr
57.651
+0.636
1.12%
1 Jan 2004 Jahr
58.457
+0.807
1.4%
1 Jan 2005 Jahr
59.142
+0.684
1.17%
1 Jan 2006 Jahr
59.535
+0.393
0.66%
1 Jan 2007 Jahr
60.237
+0.703
1.18%
1 Jan 2008 Jahr
60.336
+0.099
0.16%
1 Jan 2009 Jahr
60.159
-0.177
-0.29%
1 Jan 2010 Jahr
60.129
-0.031
-0.05%
1 Jan 2011 Jahr
60.396
+0.267
0.44%
1 Jan 2012 Jahr
60.286
-0.109
-0.18%
1 Jan 2013 Jahr
60.57
+0.284
0.47%
1 Jan 2014 Jahr
61.033
+0.463
0.76%
1 Jan 2015 Jahr
61.339
+0.306
0.5%
1 Jan 2016 Jahr
61.35
+0.011
0.02%
Bewertung der Länder gemäß mit laufender Statistik nach Jahren


Kommentare: