29
/de/
de
AIzaSyAYiBZKx7MnpbEhh9jyipgxe19OcubqV5w
April 1, 2024
244027
Solomon Islands
SLB
true
2
1
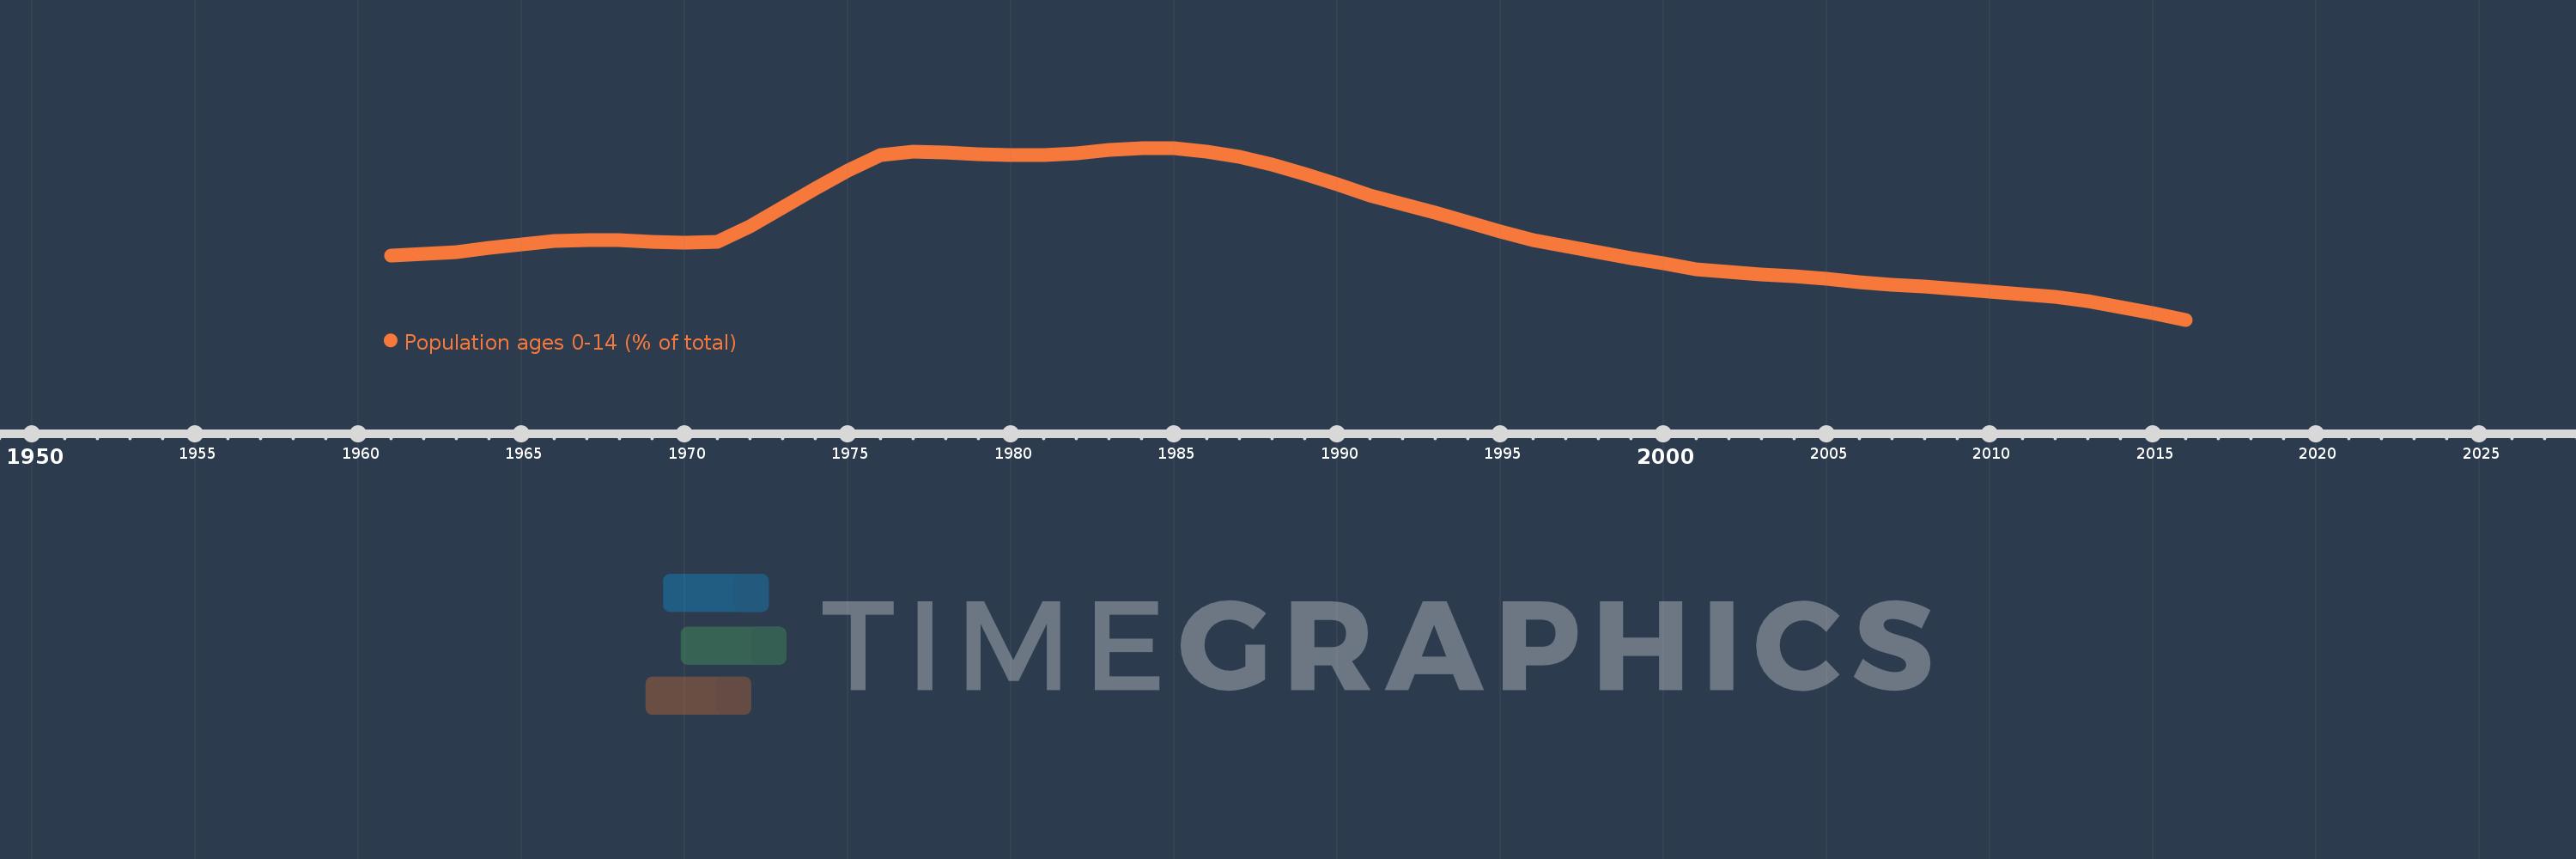
Population ages 0-14 (% of total)
2016,2015,2014,2013,2012,2011,2010,2009,2008,2007,2006,2005,2004,2003,2002,2001,2000,1999,1998,1997,1996,1995,1994,1993,1992,1991,1990,1989,1988,1987,1986,1985,1984,1983,1982,1981,1980,1979,1978,1977,1976,1975,1974,1973,1972,1971,1970,1969,1968,1967,1966,1965,1964,1963,1962,1961
Diese Statistik in anderen Ländern:
AfghanistanAlbaniaAlgeriaAngolaAntigua and BarbudaArab WorldArgentinaArmeniaArubaAustraliaAustriaAzerbaijanBahamas, TheBahrainBangladeshBarbadosBelarusBelgiumBelizeBeninBhutanBoliviaBosnia and HerzegovinaBotswanaBrazilBrunei DarussalamBulgariaBurkina FasoBurundiCabo VerdeCambodiaCameroonCanadaCaribbean small statesCentral African RepublicCentral Europe and the BalticsChadChannel IslandsChileChinaColombiaComorosCongo, Dem. Rep.Congo, Rep.Costa RicaCote d'IvoireCroatiaCubaCuracaoCyprusCzech RepublicDenmarkDjiboutiDominican RepublicEarly-demographic dividendEast Asia & PacificEast Asia & Pacific (excluding high income)East Asia & Pacific (IDA & IBRD countries)EcuadorEgypt, Arab Rep.El SalvadorEquatorial GuineaEritreaEstoniaEthiopiaEuro areaEurope & Central AsiaEurope & Central Asia (excluding high income)Europe & Central Asia (IDA & IBRD countries)European UnionFijiFinlandFragile and conflict affected situationsFranceFrench PolynesiaGabonGambia, TheGeorgiaGermanyGhanaGreeceGrenadaGuamGuatemalaGuineaGuinea-BissauGuyanaHaitiHeavily indebted poor countries (HIPC)High incomeHondurasHong Kong SAR, ChinaHungaryIBRD onlyIcelandIDA & IBRD totalIDA blendIDA onlyIDA totalIndiaIndonesiaIran, Islamic Rep.IraqIrelandIsraelItalyJamaicaJapanJordanKazakhstanKenyaKiribatiKorea, Dem. People’s Rep.Korea, Rep.KosovoKuwaitKyrgyz RepublicLao PDRLate-demographic dividendLatin America & Caribbean Latin America & Caribbean (excluding high income)Latin America & the Caribbean (IDA & IBRD countries)LatviaLeast developed countries: UN classificationLebanonLesothoLiberiaLibyaLithuaniaLow & middle incomeLow incomeLower middle incomeLuxembourgMacao SAR, ChinaMacedonia, FYRMadagascarMalawiMalaysiaMaldivesMaliMaltaMauritaniaMauritiusMexicoMicronesia, Fed. Sts.Middle East & North AfricaMiddle East & North Africa (excluding high income)Middle East & North Africa (IDA & IBRD countries)Middle incomeMoldovaMongoliaMontenegroMoroccoMozambiqueMyanmarNamibiaNepalNetherlandsNew CaledoniaNew ZealandNicaraguaNigerNigeriaNorth AmericaNorwayOECD membersOmanOther small statesPacific island small statesPakistanPanamaPapua New GuineaParaguayPeruPhilippinesPolandPortugalPost-demographic dividendPre-demographic dividendPuerto RicoQatarRomaniaRussian FederationRwandaSamoaSao Tome and PrincipeSaudi ArabiaSenegalSerbiaSeychellesSierra LeoneSingaporeSlovak RepublicSloveniaSmall statesSolomon IslandsSomaliaSouth AfricaSouth AsiaSouth Asia (IDA & IBRD)South SudanSpainSri LankaSt. LuciaSt. Vincent and the GrenadinesSub-Saharan Africa Sub-Saharan Africa (excluding high income)Sub-Saharan Africa (IDA & IBRD countries)SudanSurinameSwazilandSwedenSwitzerlandSyrian Arab RepublicTajikistanTanzaniaThailandTimor-LesteTogoTongaTrinidad and TobagoTunisiaTurkeyTurkmenistanUgandaUkraineUnited Arab EmiratesUnited KingdomUnited StatesUpper middle incomeUruguayUzbekistanVanuatuVenezuela, RBVietnamVirgin Islands (U.S.)West Bank and GazaWorldYemen, Rep.ZambiaZimbabwe Zeitlinie:
Diese Zeitleiste vorliegt die Graphik ab 1961 J. bis 2016 J. Solomon Islands. Die Angaben bis 1960 J. sind nicht vorhanden. Die Zahl aktueller Beobachtungen nach Daten: 56.
Die Quelle (Bezeichnung):
Kennzahlen der Weltentwicklung
Die Quelle (Einrichtung):
World Bank staff estimates based on age distributions of United Nations Population Division's World Population Prospects.
Kategorien:
Education, Health
Es wurde aktualisiert:
23 Apr 2017 Jahr
Kennzahlen der Wertänderungen vom Jahr zum Jahr
Minimum:
39.489
1 Jan 2016 Jahr
Maximum:
47.754
1 Jan 1984 Jahr
Zum Datum der Beobachtung
Wert
Absolute Veränderung
Die Veränderung bezüglich dem vorherigen Wert
1 Jan 1961 Jahr
42.595
+42.595
0.0%
1 Jan 1962 Jahr
42.641
+0.047
0.11%
1 Jan 1963 Jahr
42.753
+0.111
0.26%
1 Jan 1964 Jahr
42.928
+0.175
0.41%
1 Jan 1965 Jahr
43.122
+0.195
0.45%
1 Jan 1966 Jahr
43.288
+0.166
0.39%
1 Jan 1967 Jahr
43.324
+0.035
0.08%
1 Jan 1968 Jahr
43.309
-0.014
-0.03%
1 Jan 1969 Jahr
43.251
-0.059
-0.14%
1 Jan 1970 Jahr
43.206
-0.044
-0.1%
1 Jan 1971 Jahr
43.253
+0.047
0.11%
1 Jan 1972 Jahr
43.999
+0.746
1.72%
1 Jan 1973 Jahr
44.87
+0.872
1.98%
1 Jan 1974 Jahr
45.799
+0.929
2.07%
1 Jan 1975 Jahr
46.674
+0.875
1.91%
1 Jan 1976 Jahr
47.408
+0.734
1.57%
1 Jan 1977 Jahr
47.561
+0.152
0.32%
1 Jan 1978 Jahr
47.549
-0.012
-0.02%
1 Jan 1979 Jahr
47.461
-0.089
-0.19%
1 Jan 1980 Jahr
47.397
-0.064
-0.13%
1 Jan 1981 Jahr
47.399
+0.002
0.0%
1 Jan 1982 Jahr
47.509
+0.11
0.23%
1 Jan 1983 Jahr
47.647
+0.138
0.29%
1 Jan 1984 Jahr
47.754
+0.107
0.22%
1 Jan 1985 Jahr
47.745
-0.009
-0.02%
1 Jan 1986 Jahr
47.582
-0.163
-0.34%
1 Jan 1987 Jahr
47.312
-0.269
-0.57%
1 Jan 1988 Jahr
46.951
-0.361
-0.76%
1 Jan 1989 Jahr
46.5
-0.451
-0.96%
1 Jan 1990 Jahr
45.991
-0.509
-1.1%
1 Jan 1991 Jahr
45.454
-0.537
-1.17%
1 Jan 1992 Jahr
45.073
-0.381
-0.84%
1 Jan 1993 Jahr
44.632
-0.441
-0.98%
1 Jan 1994 Jahr
44.169
-0.462
-1.04%
1 Jan 1995 Jahr
43.726
-0.443
-1.0%
1 Jan 1996 Jahr
43.317
-0.409
-0.93%
1 Jan 1997 Jahr
43.023
-0.295
-0.68%
1 Jan 1998 Jahr
42.735
-0.288
-0.67%
1 Jan 1999 Jahr
42.458
-0.277
-0.65%
1 Jan 2000 Jahr
42.187
-0.27
-0.64%
1 Jan 2001 Jahr
41.922
-0.266
-0.63%
1 Jan 2002 Jahr
41.777
-0.144
-0.34%
1 Jan 2003 Jahr
41.665
-0.112
-0.27%
1 Jan 2004 Jahr
41.566
-0.099
-0.24%
1 Jan 2005 Jahr
41.452
-0.113
-0.27%
1 Jan 2006 Jahr
41.305
-0.147
-0.36%
1 Jan 2007 Jahr
41.191
-0.114
-0.27%
1 Jan 2008 Jahr
41.075
-0.116
-0.28%
1 Jan 2009 Jahr
40.962
-0.113
-0.28%
1 Jan 2010 Jahr
40.85
-0.112
-0.27%
1 Jan 2011 Jahr
40.724
-0.126
-0.31%
1 Jan 2012 Jahr
40.591
-0.132
-0.32%
1 Jan 2013 Jahr
40.381
-0.21
-0.52%
1 Jan 2014 Jahr
40.114
-0.267
-0.66%
1 Jan 2015 Jahr
39.813
-0.301
-0.75%
1 Jan 2016 Jahr
39.489
-0.324
-0.81%
Bewertung der Länder gemäß mit laufender Statistik nach Jahren


Kommentare: