29
/de/
de
AIzaSyAYiBZKx7MnpbEhh9jyipgxe19OcubqV5w
April 1, 2024
240849
Singapore
SGP
true
2
1
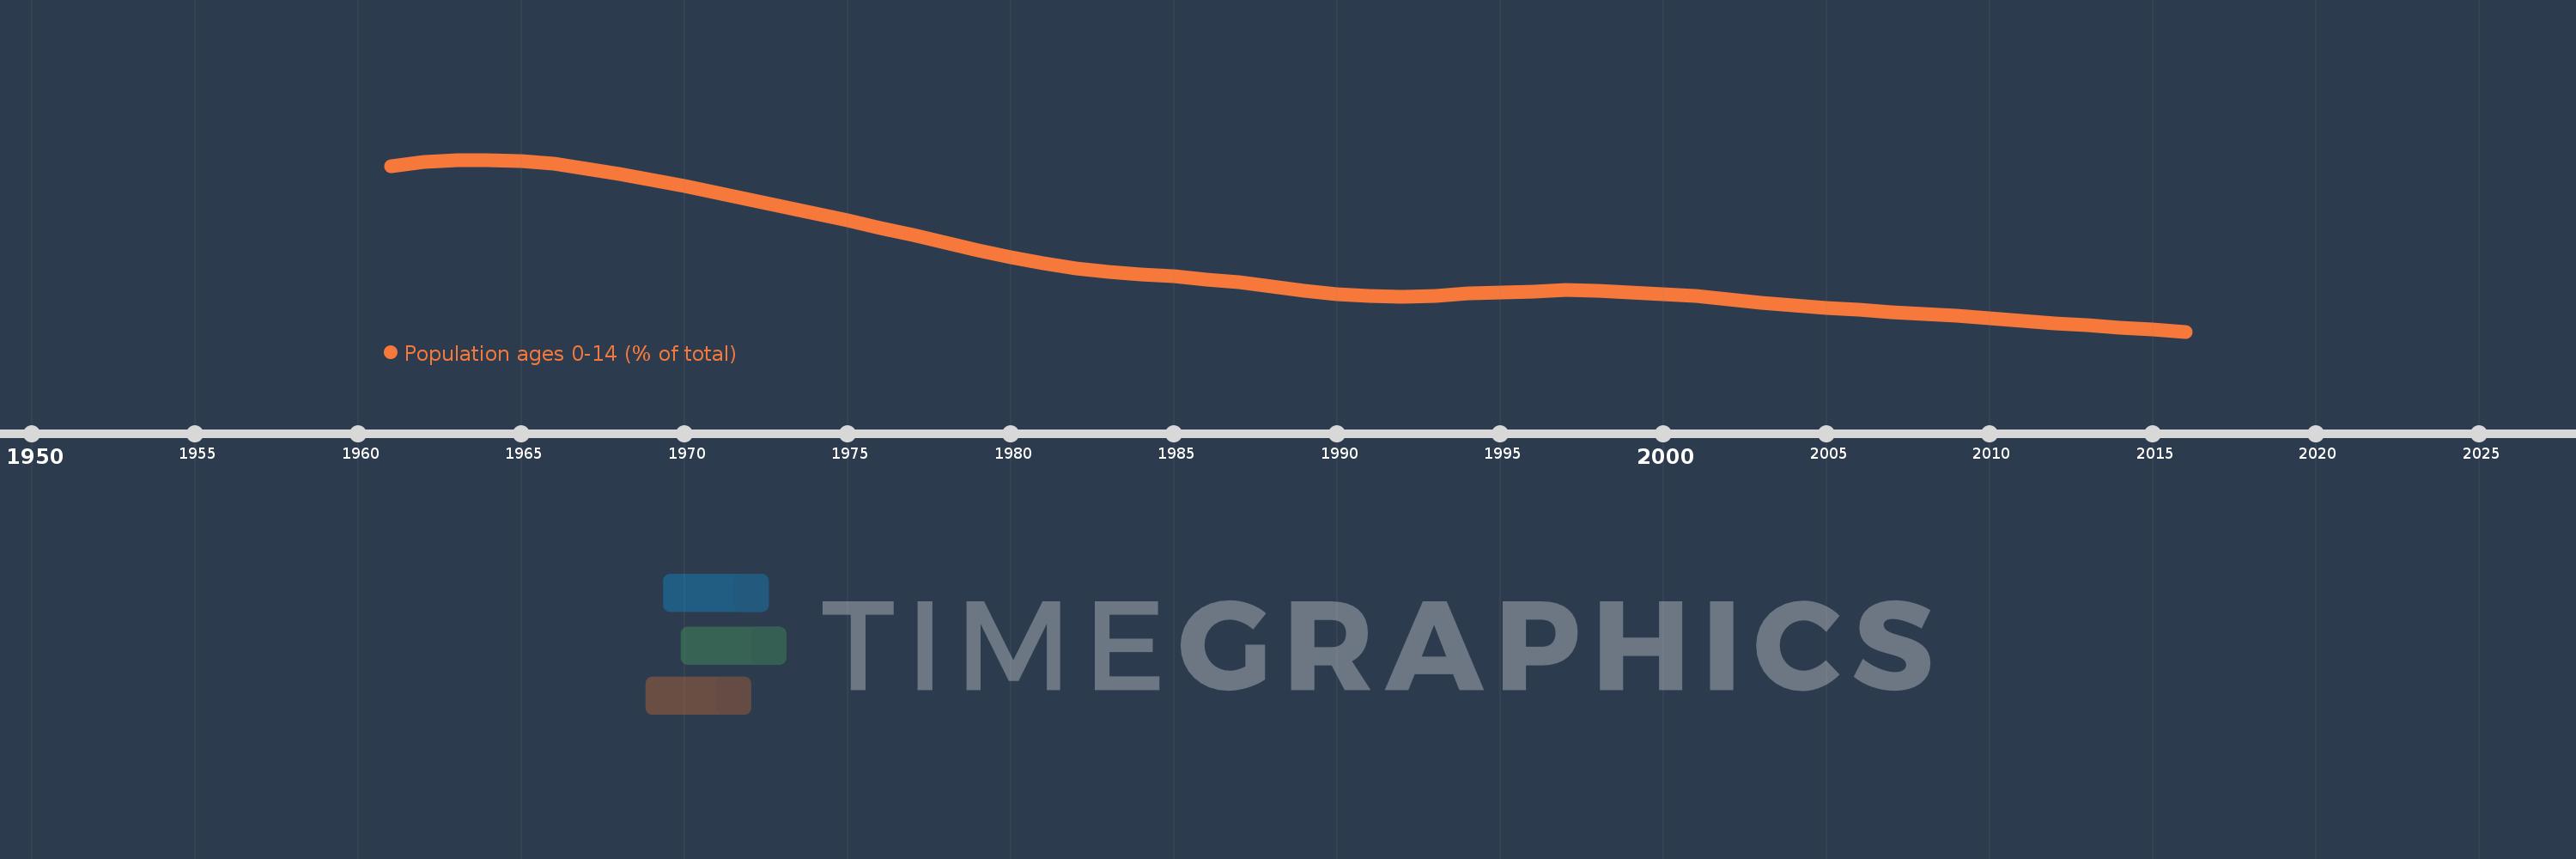
Population ages 0-14 (% of total)
2016,2015,2014,2013,2012,2011,2010,2009,2008,2007,2006,2005,2004,2003,2002,2001,2000,1999,1998,1997,1996,1995,1994,1993,1992,1991,1990,1989,1988,1987,1986,1985,1984,1983,1982,1981,1980,1979,1978,1977,1976,1975,1974,1973,1972,1971,1970,1969,1968,1967,1966,1965,1964,1963,1962,1961
Diese Statistik in anderen Ländern:
AfghanistanAlbaniaAlgeriaAngolaAntigua and BarbudaArab WorldArgentinaArmeniaArubaAustraliaAustriaAzerbaijanBahamas, TheBahrainBangladeshBarbadosBelarusBelgiumBelizeBeninBhutanBoliviaBosnia and HerzegovinaBotswanaBrazilBrunei DarussalamBulgariaBurkina FasoBurundiCabo VerdeCambodiaCameroonCanadaCaribbean small statesCentral African RepublicCentral Europe and the BalticsChadChannel IslandsChileChinaColombiaComorosCongo, Dem. Rep.Congo, Rep.Costa RicaCote d'IvoireCroatiaCubaCuracaoCyprusCzech RepublicDenmarkDjiboutiDominican RepublicEarly-demographic dividendEast Asia & PacificEast Asia & Pacific (excluding high income)East Asia & Pacific (IDA & IBRD countries)EcuadorEgypt, Arab Rep.El SalvadorEquatorial GuineaEritreaEstoniaEthiopiaEuro areaEurope & Central AsiaEurope & Central Asia (excluding high income)Europe & Central Asia (IDA & IBRD countries)European UnionFijiFinlandFragile and conflict affected situationsFranceFrench PolynesiaGabonGambia, TheGeorgiaGermanyGhanaGreeceGrenadaGuamGuatemalaGuineaGuinea-BissauGuyanaHaitiHeavily indebted poor countries (HIPC)High incomeHondurasHong Kong SAR, ChinaHungaryIBRD onlyIcelandIDA & IBRD totalIDA blendIDA onlyIDA totalIndiaIndonesiaIran, Islamic Rep.IraqIrelandIsraelItalyJamaicaJapanJordanKazakhstanKenyaKiribatiKorea, Dem. People’s Rep.Korea, Rep.KosovoKuwaitKyrgyz RepublicLao PDRLate-demographic dividendLatin America & Caribbean Latin America & Caribbean (excluding high income)Latin America & the Caribbean (IDA & IBRD countries)LatviaLeast developed countries: UN classificationLebanonLesothoLiberiaLibyaLithuaniaLow & middle incomeLow incomeLower middle incomeLuxembourgMacao SAR, ChinaMacedonia, FYRMadagascarMalawiMalaysiaMaldivesMaliMaltaMauritaniaMauritiusMexicoMicronesia, Fed. Sts.Middle East & North AfricaMiddle East & North Africa (excluding high income)Middle East & North Africa (IDA & IBRD countries)Middle incomeMoldovaMongoliaMontenegroMoroccoMozambiqueMyanmarNamibiaNepalNetherlandsNew CaledoniaNew ZealandNicaraguaNigerNigeriaNorth AmericaNorwayOECD membersOmanOther small statesPacific island small statesPakistanPanamaPapua New GuineaParaguayPeruPhilippinesPolandPortugalPost-demographic dividendPre-demographic dividendPuerto RicoQatarRomaniaRussian FederationRwandaSamoaSao Tome and PrincipeSaudi ArabiaSenegalSerbiaSeychellesSierra LeoneSingaporeSlovak RepublicSloveniaSmall statesSolomon IslandsSomaliaSouth AfricaSouth AsiaSouth Asia (IDA & IBRD)South SudanSpainSri LankaSt. LuciaSt. Vincent and the GrenadinesSub-Saharan Africa Sub-Saharan Africa (excluding high income)Sub-Saharan Africa (IDA & IBRD countries)SudanSurinameSwazilandSwedenSwitzerlandSyrian Arab RepublicTajikistanTanzaniaThailandTimor-LesteTogoTongaTrinidad and TobagoTunisiaTurkeyTurkmenistanUgandaUkraineUnited Arab EmiratesUnited KingdomUnited StatesUpper middle incomeUruguayUzbekistanVanuatuVenezuela, RBVietnamVirgin Islands (U.S.)West Bank and GazaWorldYemen, Rep.ZambiaZimbabwe Zeitlinie:
Diese Zeitleiste vorliegt die Graphik ab 1961 J. bis 2016 J. Singapore. Die Angaben bis 1960 J. sind nicht vorhanden. Die Zahl aktueller Beobachtungen nach Daten: 56.
Die Quelle (Bezeichnung):
Kennzahlen der Weltentwicklung
Die Quelle (Einrichtung):
World Bank staff estimates based on age distributions of United Nations Population Division's World Population Prospects.
Kategorien:
Education, Health
Es wurde aktualisiert:
23 Apr 2017 Jahr
Kennzahlen der Wertänderungen vom Jahr zum Jahr
Minimum:
15.543
1 Jan 2016 Jahr
Maximum:
44.352
1 Jan 1964 Jahr
Zum Datum der Beobachtung
Wert
Absolute Veränderung
Die Veränderung bezüglich dem vorherigen Wert
1 Jan 1961 Jahr
43.245
+43.245
0.0%
1 Jan 1962 Jahr
43.956
+0.711
1.64%
1 Jan 1963 Jahr
44.323
+0.367
0.83%
1 Jan 1964 Jahr
44.352
+0.029
0.07%
1 Jan 1965 Jahr
44.112
-0.24
-0.54%
1 Jan 1966 Jahr
43.678
-0.434
-0.98%
1 Jan 1967 Jahr
42.871
-0.807
-1.85%
1 Jan 1968 Jahr
41.993
-0.878
-2.05%
1 Jan 1969 Jahr
41.031
-0.962
-2.29%
1 Jan 1970 Jahr
39.963
-1.068
-2.6%
1 Jan 1971 Jahr
38.798
-1.165
-2.92%
1 Jan 1972 Jahr
37.608
-1.19
-3.07%
1 Jan 1973 Jahr
36.471
-1.136
-3.02%
1 Jan 1974 Jahr
35.333
-1.138
-3.12%
1 Jan 1975 Jahr
34.127
-1.205
-3.41%
1 Jan 1976 Jahr
32.835
-1.292
-3.79%
1 Jan 1977 Jahr
31.777
-1.058
-3.22%
1 Jan 1978 Jahr
30.511
-1.266
-3.98%
1 Jan 1979 Jahr
29.176
-1.335
-4.38%
1 Jan 1980 Jahr
27.984
-1.192
-4.08%
1 Jan 1981 Jahr
27.055
-0.93
-3.32%
1 Jan 1982 Jahr
26.128
-0.926
-3.42%
1 Jan 1983 Jahr
25.534
-0.594
-2.27%
1 Jan 1984 Jahr
25.154
-0.38
-1.49%
1 Jan 1985 Jahr
24.779
-0.375
-1.49%
1 Jan 1986 Jahr
24.297
-0.482
-1.95%
1 Jan 1987 Jahr
23.787
-0.51
-2.1%
1 Jan 1988 Jahr
23.107
-0.68
-2.86%
1 Jan 1989 Jahr
22.382
-0.725
-3.14%
1 Jan 1990 Jahr
21.8
-0.582
-2.6%
1 Jan 1991 Jahr
21.463
-0.337
-1.55%
1 Jan 1992 Jahr
21.396
-0.067
-0.31%
1 Jan 1993 Jahr
21.572
+0.177
0.83%
1 Jan 1994 Jahr
21.895
+0.323
1.5%
1 Jan 1995 Jahr
22.166
+0.271
1.24%
1 Jan 1996 Jahr
22.251
+0.085
0.38%
1 Jan 1997 Jahr
22.503
+0.252
1.13%
1 Jan 1998 Jahr
22.447
-0.055
-0.25%
1 Jan 1999 Jahr
22.158
-0.289
-1.29%
1 Jan 2000 Jahr
21.792
-0.366
-1.65%
1 Jan 2001 Jahr
21.463
-0.329
-1.51%
1 Jan 2002 Jahr
20.877
-0.585
-2.73%
1 Jan 2003 Jahr
20.362
-0.516
-2.47%
1 Jan 2004 Jahr
19.931
-0.431
-2.11%
1 Jan 2005 Jahr
19.54
-0.391
-1.96%
1 Jan 2006 Jahr
19.15
-0.39
-2.0%
1 Jan 2007 Jahr
18.851
-0.298
-1.56%
1 Jan 2008 Jahr
18.545
-0.306
-1.63%
1 Jan 2009 Jahr
18.183
-0.362
-1.95%
1 Jan 2010 Jahr
17.771
-0.412
-2.26%
1 Jan 2011 Jahr
17.342
-0.429
-2.41%
1 Jan 2012 Jahr
16.956
-0.386
-2.22%
1 Jan 2013 Jahr
16.586
-0.37
-2.18%
1 Jan 2014 Jahr
16.228
-0.358
-2.16%
1 Jan 2015 Jahr
15.881
-0.348
-2.14%
1 Jan 2016 Jahr
15.543
-0.338
-2.13%
Bewertung der Länder gemäß mit laufender Statistik nach Jahren


Kommentare: