29
/de/
de
AIzaSyAYiBZKx7MnpbEhh9jyipgxe19OcubqV5w
April 1, 2024
233929
Sao Tome and Principe
STP
true
2
1
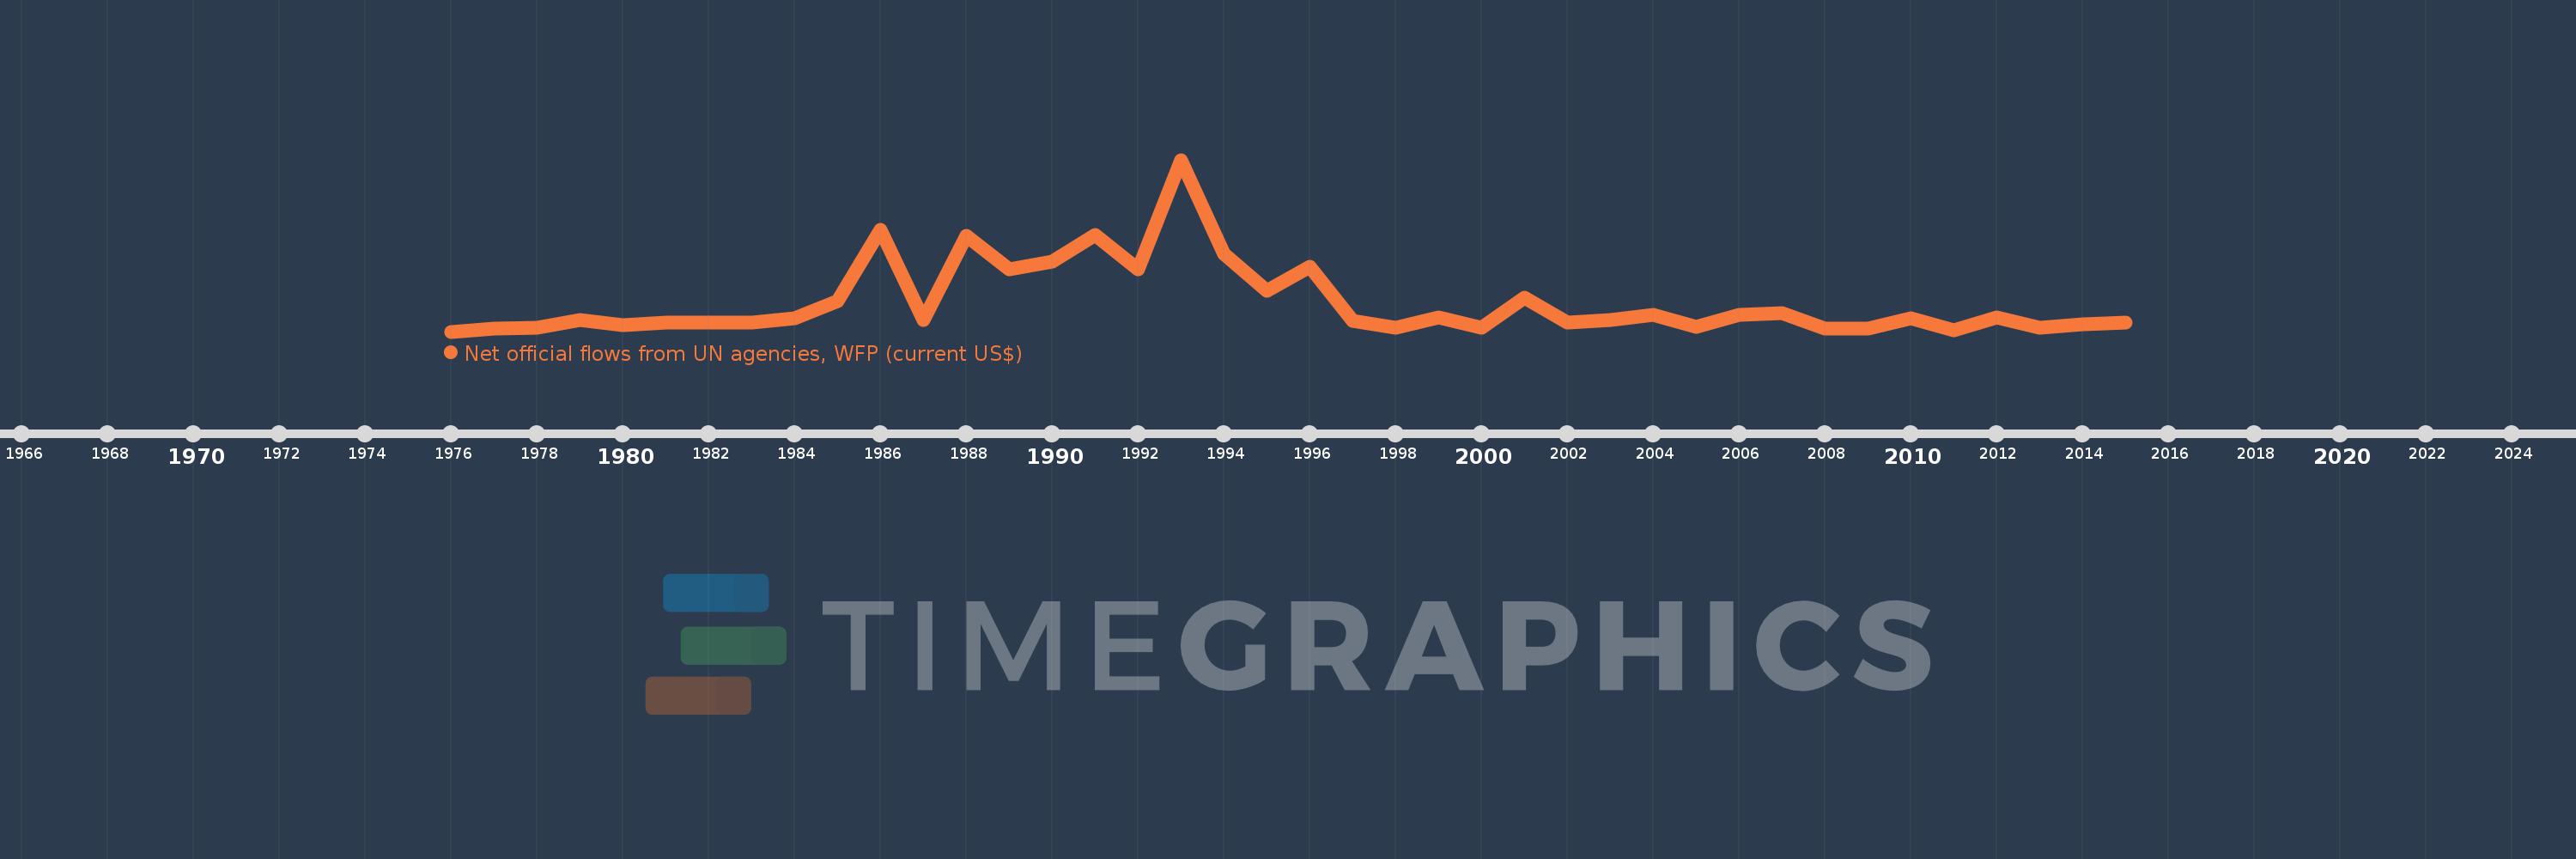
Net official flows from UN agencies, WFP (current US$)
2015,2014,2013,2012,2011,2010,2009,2008,2007,2006,2005,2004,2003,2002,2001,2000,1999,1998,1997,1996,1995,1994,1993,1992,1991,1990,1989,1988,1987,1986,1985,1984,1983,1982,1981,1980,1979,1978,1977,1976
Diese Statistik in anderen Ländern:
AfghanistanAlbaniaAlgeriaAngolaAntigua and BarbudaArab WorldArgentinaArmeniaAzerbaijanBangladeshBarbadosBelizeBeninBhutanBoliviaBosnia and HerzegovinaBotswanaBrazilBulgariaBurkina FasoBurundiCabo VerdeCambodiaCameroonCaribbean small statesCentral African RepublicCentral Europe and the BalticsChadChileChinaColombiaComorosCongo, Dem. Rep.Congo, Rep.Costa RicaCote d'IvoireCubaCyprusDjiboutiDominicaDominican RepublicEast Asia & PacificEast Asia & Pacific (excluding high income)East Asia & Pacific (IDA & IBRD countries)EcuadorEgypt, Arab Rep.El SalvadorEquatorial GuineaEritreaEstoniaEthiopiaEuro areaEurope & Central AsiaEurope & Central Asia (excluding high income)Europe & Central Asia (IDA & IBRD countries)European UnionFijiFragile and conflict affected situationsGabonGambia, TheGeorgiaGhanaGrenadaGuatemalaGuineaGuinea-BissauGuyanaHaitiHeavily indebted poor countries (HIPC)High incomeHondurasIBRD onlyIDA & IBRD totalIDA blendIDA onlyIDA totalIndiaIndonesiaIran, Islamic Rep.IraqJamaicaJordanKenyaKorea, Dem. People’s Rep.Korea, Rep.KuwaitKyrgyz RepublicLao PDRLatin America & Caribbean Latin America & Caribbean (excluding high income)Latin America & the Caribbean (IDA & IBRD countries)Least developed countries: UN classificationLebanonLesothoLiberiaLibyaLow & middle incomeLow incomeLower middle incomeMacedonia, FYRMadagascarMalawiMalaysiaMaldivesMaliMaltaMauritaniaMauritiusMexicoMiddle East & North AfricaMiddle East & North Africa (excluding high income)Middle East & North Africa (IDA & IBRD countries)Middle incomeMoldovaMongoliaMoroccoMozambiqueMyanmarNamibiaNepalNicaraguaNigerNigeriaOECD membersOmanOther small statesPacific island small statesPakistanPanamaPapua New GuineaParaguayPeruPhilippinesPolandRomaniaRussian FederationRwandaSamoaSao Tome and PrincipeSenegalSerbiaSeychellesSierra LeoneSingaporeSmall statesSolomon IslandsSomaliaSouth AfricaSouth AsiaSouth Asia (IDA & IBRD)South SudanSri LankaSt. Kitts and NevisSt. LuciaSt. Vincent and the GrenadinesSub-Saharan Africa Sub-Saharan Africa (excluding high income)Sub-Saharan Africa (IDA & IBRD countries)SudanSurinameSwazilandSyrian Arab RepublicTajikistanTanzaniaThailandTimor-LesteTogoTongaTrinidad and TobagoTunisiaTurkeyTurkmenistanUgandaUnited Arab EmiratesUpper middle incomeUruguayVanuatuVenezuela, RBVietnamWest Bank and GazaWorldYemen, Rep.ZambiaZimbabwe Zeitlinie:
Diese Zeitleiste vorliegt die Graphik ab 1976 J. bis 2015 J. Sao Tome and Principe. Die Angaben bis 1975 J. sind nicht vorhanden. Die Zahl aktueller Beobachtungen nach Daten: 40.
Die Quelle (Bezeichnung):
Kennzahlen der Weltentwicklung
Die Quelle (Einrichtung):
Development Assistance Committee of the Organisation for Economic Co-operation and Development, Geographical Distribution of Financial Flows to Developing Countries, Development Co-operation Report, and International Development Statistics database. Data are available online at: www.oecd.org/dac/stats/idsonline.
Kategorien:
Aid Effectiveness
Es wurde aktualisiert:
23 Apr 2017 Jahr
Kennzahlen der Wertänderungen vom Jahr zum Jahr
im Durchschnitt:
996.25 Tsnd.
Minimum:
50.0 Tsnd.
1 Jan 1976 Jahr
Maximum:
5.7 Mln.
1 Jan 1993 Jahr
Zum Datum der Beobachtung
Wert
Absolute Veränderung
Die Veränderung bezüglich dem vorherigen Wert
1 Jan 1976 Jahr
50.0 Tsnd.
+50.0 Tsnd.
0.0%
1 Jan 1977 Jahr
160.0 Tsnd.
+110.0 Tsnd.
220.0%
1 Jan 1978 Jahr
170.0 Tsnd.
+10.0 Tsnd.
6.25%
1 Jan 1979 Jahr
430.0 Tsnd.
+260.0 Tsnd.
152.94%
1 Jan 1980 Jahr
260.0 Tsnd.
-170.0 Tsnd.
-39.53%
1 Jan 1981 Jahr
340.0 Tsnd.
+80.0 Tsnd.
30.77%
1 Jan 1982 Jahr
360.0 Tsnd.
+20.0 Tsnd.
5.88%
1 Jan 1983 Jahr
340.0 Tsnd.
-20.0 Tsnd.
-5.56%
1 Jan 1984 Jahr
480.0 Tsnd.
+140.0 Tsnd.
41.18%
1 Jan 1985 Jahr
1.04 Mln.
+560.0 Tsnd.
116.67%
1 Jan 1986 Jahr
3.39 Mln.
+2.35 Mln.
225.96%
1 Jan 1987 Jahr
430.0 Tsnd.
-2.96 Mln.
-87.32%
1 Jan 1988 Jahr
3.2 Mln.
+2.77 Mln.
644.19%
1 Jan 1989 Jahr
2.09 Mln.
-1.11 Mln.
-34.69%
1 Jan 1990 Jahr
2.36 Mln.
+270.0 Tsnd.
12.92%
1 Jan 1991 Jahr
3.24 Mln.
+880.0 Tsnd.
37.29%
1 Jan 1992 Jahr
2.11 Mln.
-1.13 Mln.
-34.88%
1 Jan 1993 Jahr
5.7 Mln.
+3.59 Mln.
170.14%
1 Jan 1994 Jahr
2.61 Mln.
-3.09 Mln.
-54.21%
1 Jan 1995 Jahr
1.39 Mln.
-1.22 Mln.
-46.74%
1 Jan 1996 Jahr
2.18 Mln.
+790.0 Tsnd.
56.83%
1 Jan 1997 Jahr
390.0 Tsnd.
-1.79 Mln.
-82.11%
1 Jan 1998 Jahr
170.0 Tsnd.
-220.0 Tsnd.
-56.41%
1 Jan 1999 Jahr
530.0 Tsnd.
+360.0 Tsnd.
211.76%
1 Jan 2000 Jahr
180.0 Tsnd.
-350.0 Tsnd.
-66.04%
1 Jan 2001 Jahr
1.17 Mln.
+990.0 Tsnd.
550.0%
1 Jan 2002 Jahr
360.0 Tsnd.
-810.0 Tsnd.
-69.23%
1 Jan 2003 Jahr
430.0 Tsnd.
+70.0 Tsnd.
19.44%
1 Jan 2004 Jahr
610.0 Tsnd.
+180.0 Tsnd.
41.86%
1 Jan 2005 Jahr
200.0 Tsnd.
-410.0 Tsnd.
-67.21%
1 Jan 2006 Jahr
600.0 Tsnd.
+400.0 Tsnd.
200.0%
1 Jan 2007 Jahr
650.0 Tsnd.
+50.0 Tsnd.
8.33%
1 Jan 2008 Jahr
150.0 Tsnd.
-500.0 Tsnd.
-76.92%
1 Jan 2009 Jahr
140.0 Tsnd.
-10.0 Tsnd.
-6.67%
1 Jan 2010 Jahr
480.0 Tsnd.
+340.0 Tsnd.
242.86%
1 Jan 2011 Jahr
100.0 Tsnd.
-380.0 Tsnd.
-79.17%
1 Jan 2012 Jahr
530.0 Tsnd.
+430.0 Tsnd.
430.0%
1 Jan 2013 Jahr
190.0 Tsnd.
-340.0 Tsnd.
-64.15%
1 Jan 2014 Jahr
290.0 Tsnd.
+100.0 Tsnd.
52.63%
1 Jan 2015 Jahr
350.0 Tsnd.
+60.0 Tsnd.
20.69%
Bewertung der Länder gemäß mit laufender Statistik nach Jahren


Kommentare: