29
/de/
de
AIzaSyAYiBZKx7MnpbEhh9jyipgxe19OcubqV5w
April 1, 2024
122547
Dominican Republic
DOM
true
2
1
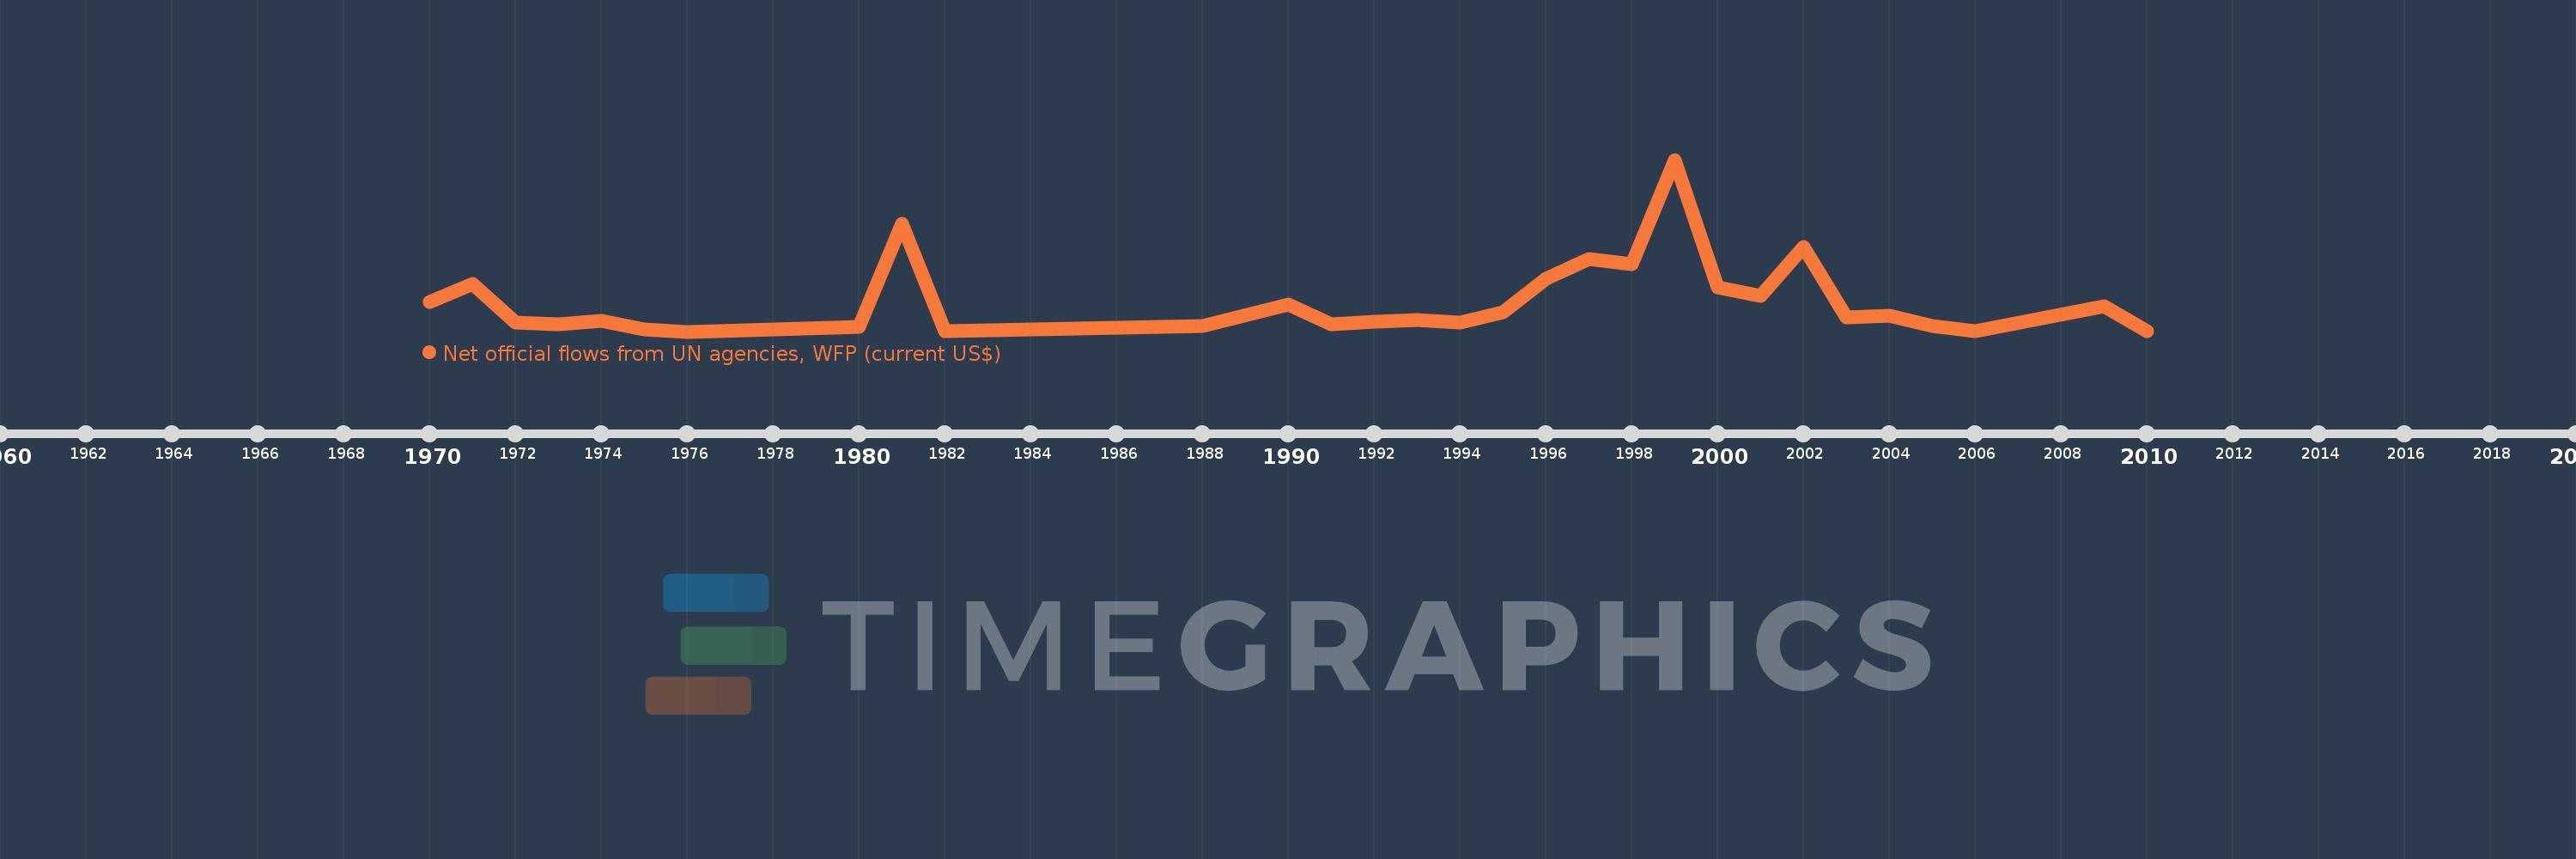
Net official flows from UN agencies, WFP (current US$)
2010,2009,2006,2005,2004,2003,2002,2001,2000,1999,1998,1997,1996,1995,1994,1993,1992,1991,1990,1988,1982,1981,1980,1976,1975,1974,1973,1972,1971,1970
Diese Statistik in anderen Ländern:
AfghanistanAlbaniaAlgeriaAngolaAntigua and BarbudaArab WorldArgentinaArmeniaAzerbaijanBangladeshBarbadosBelizeBeninBhutanBoliviaBosnia and HerzegovinaBotswanaBrazilBulgariaBurkina FasoBurundiCabo VerdeCambodiaCameroonCaribbean small statesCentral African RepublicCentral Europe and the BalticsChadChileChinaColombiaComorosCongo, Dem. Rep.Congo, Rep.Costa RicaCote d'IvoireCubaCyprusDjiboutiDominicaDominican RepublicEast Asia & PacificEast Asia & Pacific (excluding high income)East Asia & Pacific (IDA & IBRD countries)EcuadorEgypt, Arab Rep.El SalvadorEquatorial GuineaEritreaEstoniaEthiopiaEuro areaEurope & Central AsiaEurope & Central Asia (excluding high income)Europe & Central Asia (IDA & IBRD countries)European UnionFijiFragile and conflict affected situationsGabonGambia, TheGeorgiaGhanaGrenadaGuatemalaGuineaGuinea-BissauGuyanaHaitiHeavily indebted poor countries (HIPC)High incomeHondurasIBRD onlyIDA & IBRD totalIDA blendIDA onlyIDA totalIndiaIndonesiaIran, Islamic Rep.IraqJamaicaJordanKenyaKorea, Dem. People’s Rep.Korea, Rep.KuwaitKyrgyz RepublicLao PDRLatin America & Caribbean Latin America & Caribbean (excluding high income)Latin America & the Caribbean (IDA & IBRD countries)Least developed countries: UN classificationLebanonLesothoLiberiaLibyaLow & middle incomeLow incomeLower middle incomeMacedonia, FYRMadagascarMalawiMalaysiaMaldivesMaliMaltaMauritaniaMauritiusMexicoMiddle East & North AfricaMiddle East & North Africa (excluding high income)Middle East & North Africa (IDA & IBRD countries)Middle incomeMoldovaMongoliaMoroccoMozambiqueMyanmarNamibiaNepalNicaraguaNigerNigeriaOECD membersOmanOther small statesPacific island small statesPakistanPanamaPapua New GuineaParaguayPeruPhilippinesPolandRomaniaRussian FederationRwandaSamoaSao Tome and PrincipeSenegalSerbiaSeychellesSierra LeoneSingaporeSmall statesSolomon IslandsSomaliaSouth AfricaSouth AsiaSouth Asia (IDA & IBRD)South SudanSri LankaSt. Kitts and NevisSt. LuciaSt. Vincent and the GrenadinesSub-Saharan Africa Sub-Saharan Africa (excluding high income)Sub-Saharan Africa (IDA & IBRD countries)SudanSurinameSwazilandSyrian Arab RepublicTajikistanTanzaniaThailandTimor-LesteTogoTongaTrinidad and TobagoTunisiaTurkeyTurkmenistanUgandaUnited Arab EmiratesUpper middle incomeUruguayVanuatuVenezuela, RBVietnamWest Bank and GazaWorldYemen, Rep.ZambiaZimbabwe Zeitlinie:
Diese Zeitleiste vorliegt die Graphik ab 1970 J. bis 2010 J. Dominican Republic. Die Angaben bis 1969 J. sind nicht vorhanden. Die Zahl aktueller Beobachtungen nach Daten: 30.
Die Quelle (Bezeichnung):
Kennzahlen der Weltentwicklung
Die Quelle (Einrichtung):
Development Assistance Committee of the Organisation for Economic Co-operation and Development, Geographical Distribution of Financial Flows to Developing Countries, Development Co-operation Report, and International Development Statistics database. Data are available online at: www.oecd.org/dac/stats/idsonline.
Kategorien:
Aid Effectiveness
Es wurde aktualisiert:
23 Apr 2017 Jahr
Kennzahlen der Wertänderungen vom Jahr zum Jahr
im Durchschnitt:
811.667 Tsnd.
Minimum:
10.0 Tsnd.
1 Jan 1976 Jahr
Maximum:
4.6 Mln.
1 Jan 1999 Jahr
Zum Datum der Beobachtung
Wert
Absolute Veränderung
Die Veränderung bezüglich dem vorherigen Wert
1 Jan 1970 Jahr
800.0 Tsnd.
+800.0 Tsnd.
0.0%
1 Jan 1971 Jahr
1.28 Mln.
+480.0 Tsnd.
60.0%
1 Jan 1972 Jahr
260.0 Tsnd.
-1.02 Mln.
-79.69%
1 Jan 1973 Jahr
200.0 Tsnd.
-60.0 Tsnd.
-23.08%
1 Jan 1974 Jahr
300.0 Tsnd.
+100.0 Tsnd.
50.0%
1 Jan 1975 Jahr
70.0 Tsnd.
-230.0 Tsnd.
-76.67%
1 Jan 1976 Jahr
10.0 Tsnd.
-60.0 Tsnd.
-85.71%
1 Jan 1980 Jahr
130.0 Tsnd.
+120.0 Tsnd.
1.2 Tsnd.%
1 Jan 1981 Jahr
2.88 Mln.
+2.75 Mln.
2.12 Tsnd.%
1 Jan 1982 Jahr
30.0 Tsnd.
-2.85 Mln.
-98.96%
1 Jan 1988 Jahr
170.0 Tsnd.
+140.0 Tsnd.
466.67%
1 Jan 1990 Jahr
730.0 Tsnd.
+560.0 Tsnd.
329.41%
1 Jan 1991 Jahr
200.0 Tsnd.
-530.0 Tsnd.
-72.6%
1 Jan 1992 Jahr
280.0 Tsnd.
+80.0 Tsnd.
40.0%
1 Jan 1993 Jahr
330.0 Tsnd.
+50.0 Tsnd.
17.86%
1 Jan 1994 Jahr
240.0 Tsnd.
-90.0 Tsnd.
-27.27%
1 Jan 1995 Jahr
520.0 Tsnd.
+280.0 Tsnd.
116.67%
1 Jan 1996 Jahr
1.41 Mln.
+890.0 Tsnd.
171.15%
1 Jan 1997 Jahr
1.94 Mln.
+530.0 Tsnd.
37.59%
1 Jan 1998 Jahr
1.82 Mln.
-120.0 Tsnd.
-6.19%
1 Jan 1999 Jahr
4.6 Mln.
+2.78 Mln.
152.75%
1 Jan 2000 Jahr
1.2 Mln.
-3.4 Mln.
-73.91%
1 Jan 2001 Jahr
960.0 Tsnd.
-240.0 Tsnd.
-20.0%
1 Jan 2002 Jahr
2.26 Mln.
+1.3 Mln.
135.42%
1 Jan 2003 Jahr
380.0 Tsnd.
-1.88 Mln.
-83.19%
1 Jan 2004 Jahr
440.0 Tsnd.
+60.0 Tsnd.
15.79%
1 Jan 2005 Jahr
170.0 Tsnd.
-270.0 Tsnd.
-61.36%
1 Jan 2006 Jahr
20.0 Tsnd.
-150.0 Tsnd.
-88.24%
1 Jan 2009 Jahr
690.0 Tsnd.
+670.0 Tsnd.
3.35 Tsnd.%
1 Jan 2010 Jahr
30.0 Tsnd.
-660.0 Tsnd.
-95.65%
Bewertung der Länder gemäß mit laufender Statistik nach Jahren


Kommentare: