29
/de/
de
AIzaSyAYiBZKx7MnpbEhh9jyipgxe19OcubqV5w
April 1, 2024
221103
Paraguay
PRY
true
2
1
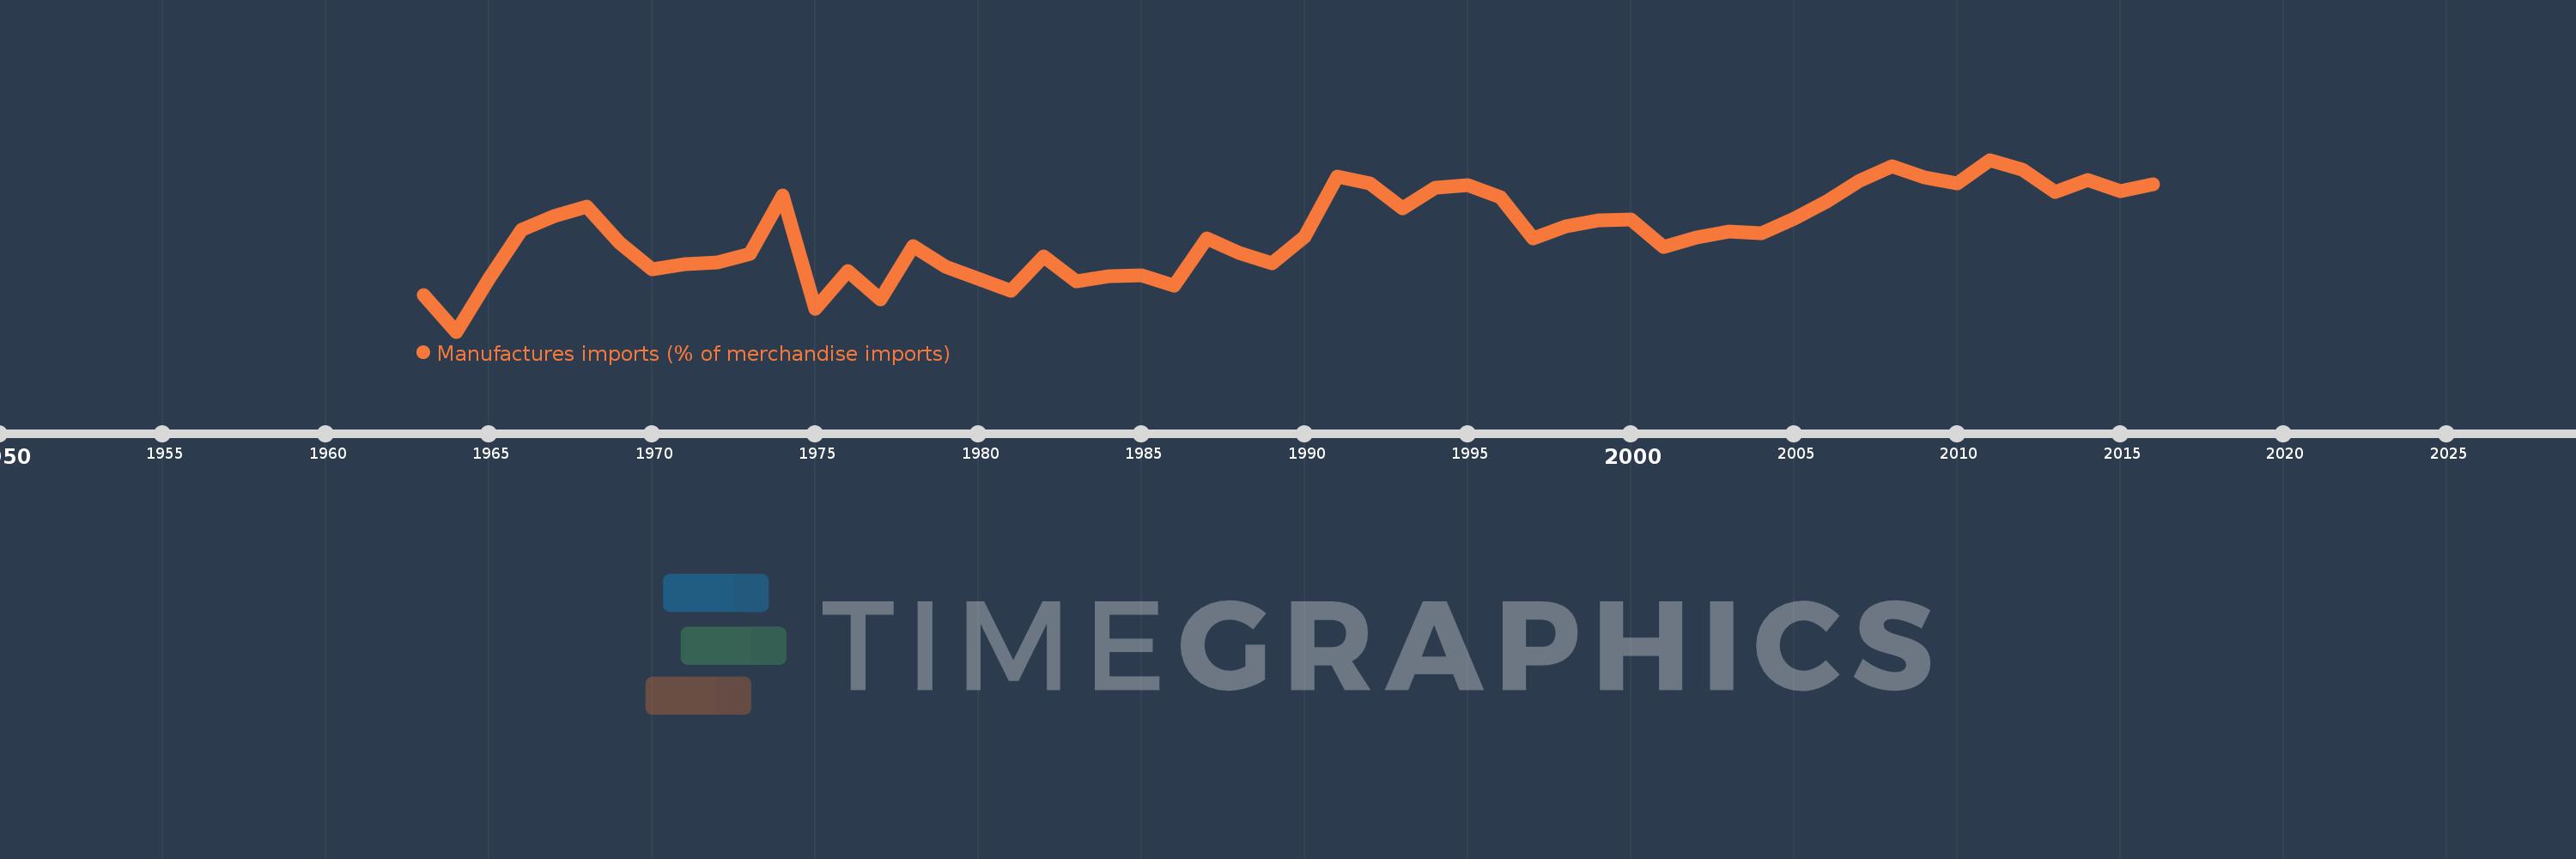
Manufactures imports (% of merchandise imports)
2016,2015,2014,2013,2012,2011,2010,2009,2008,2007,2006,2005,2004,2003,2002,2001,2000,1999,1998,1997,1996,1995,1994,1993,1992,1991,1990,1989,1988,1987,1986,1985,1984,1983,1982,1981,1980,1979,1978,1977,1976,1975,1974,1973,1972,1971,1970,1969,1968,1967,1966,1965,1964,1963
Diese Statistik in anderen Ländern:
AfghanistanAlbaniaAlgeriaAndorraAngolaAntigua and BarbudaArab WorldArgentinaArmeniaArubaAustraliaAustriaAzerbaijanBahamas, TheBahrainBangladeshBarbadosBelarusBelgiumBelizeBeninBermudaBhutanBoliviaBosnia and HerzegovinaBotswanaBrazilBrunei DarussalamBulgariaBurkina FasoBurundiCabo VerdeCambodiaCameroonCanadaCaribbean small statesCayman IslandsCentral African RepublicCentral Europe and the BalticsChadChileChinaColombiaComorosCongo, Dem. Rep.Congo, Rep.Costa RicaCote d'IvoireCroatiaCubaCyprusCzech RepublicDenmarkDjiboutiDominicaDominican RepublicEarly-demographic dividendEast Asia & PacificEast Asia & Pacific (excluding high income)East Asia & Pacific (IDA & IBRD countries)EcuadorEgypt, Arab Rep.El SalvadorEquatorial GuineaEritreaEstoniaEthiopiaEuro areaEurope & Central AsiaEurope & Central Asia (excluding high income)Europe & Central Asia (IDA & IBRD countries)European UnionFaroe IslandsFijiFinlandFragile and conflict affected situationsFranceFrench PolynesiaGabonGambia, TheGeorgiaGermanyGhanaGreeceGreenlandGrenadaGuatemalaGuineaGuinea-BissauGuyanaHaitiHeavily indebted poor countries (HIPC)High incomeHondurasHong Kong SAR, ChinaHungaryIBRD onlyIcelandIDA & IBRD totalIDA blendIDA onlyIDA totalIndiaIndonesiaIran, Islamic Rep.IraqIrelandIsraelItalyJamaicaJapanJordanKazakhstanKenyaKiribatiKorea, Rep.KuwaitKyrgyz RepublicLao PDRLate-demographic dividendLatin America & Caribbean Latin America & Caribbean (excluding high income)Latin America & the Caribbean (IDA & IBRD countries)LatviaLeast developed countries: UN classificationLebanonLesothoLiberiaLibyaLithuaniaLow & middle incomeLow incomeLower middle incomeLuxembourgMacao SAR, ChinaMacedonia, FYRMadagascarMalawiMalaysiaMaldivesMaliMaltaMauritaniaMauritiusMexicoMiddle East & North AfricaMiddle East & North Africa (excluding high income)Middle East & North Africa (IDA & IBRD countries)Middle incomeMoldovaMongoliaMoroccoMozambiqueMyanmarNamibiaNepalNetherlandsNew CaledoniaNew ZealandNicaraguaNigerNigeriaNorth AmericaNorwayOECD membersOmanOther small statesPacific island small statesPakistanPalauPanamaPapua New GuineaParaguayPeruPhilippinesPolandPortugalPost-demographic dividendPre-demographic dividendQatarRomaniaRussian FederationRwandaSamoaSao Tome and PrincipeSaudi ArabiaSenegalSerbiaSeychellesSierra LeoneSingaporeSlovak RepublicSloveniaSmall statesSolomon IslandsSomaliaSouth AfricaSouth AsiaSouth Asia (IDA & IBRD)SpainSri LankaSt. Kitts and NevisSt. LuciaSt. Vincent and the GrenadinesSub-Saharan Africa Sub-Saharan Africa (excluding high income)Sub-Saharan Africa (IDA & IBRD countries)SudanSurinameSwazilandSwedenSwitzerlandSyrian Arab RepublicTajikistanTanzaniaThailandTimor-LesteTogoTongaTrinidad and TobagoTunisiaTurkeyTurkmenistanTurks and Caicos IslandsTuvaluUgandaUkraineUnited Arab EmiratesUnited KingdomUnited StatesUpper middle incomeUruguayVanuatuVenezuela, RBVietnamVirgin Islands (U.S.)WorldYemen, Rep.ZambiaZimbabwe Zeitlinie:
Diese Zeitleiste vorliegt die Graphik ab 1963 J. bis 2016 J. Paraguay. Die Angaben bis 1962 J. sind nicht vorhanden. Die Zahl aktueller Beobachtungen nach Daten: 54.
Die Quelle (Bezeichnung):
Kennzahlen der Weltentwicklung
Die Quelle (Einrichtung):
World Bank staff estimates from the Comtrade database maintained by the United Nations Statistics Division.
Kategorien:
Private Sector, Trade
Es wurde aktualisiert:
23 Apr 2017 Jahr
Kennzahlen der Wertänderungen vom Jahr zum Jahr
Minimum:
53.481
1 Jan 1964 Jahr
Maximum:
79.365
1 Jan 2011 Jahr
Zum Datum der Beobachtung
Wert
Absolute Veränderung
Die Veränderung bezüglich dem vorherigen Wert
1 Jan 1963 Jahr
58.944
+58.944
0.0%
1 Jan 1964 Jahr
53.481
-5.463
-9.27%
1 Jan 1965 Jahr
61.405
+7.923
14.82%
1 Jan 1966 Jahr
68.865
+7.46
12.15%
1 Jan 1967 Jahr
70.827
+1.962
2.85%
1 Jan 1968 Jahr
72.271
+1.444
2.04%
1 Jan 1969 Jahr
66.816
-5.455
-7.55%
1 Jan 1970 Jahr
62.81
-4.006
-6.0%
1 Jan 1971 Jahr
63.667
+0.857
1.36%
1 Jan 1972 Jahr
63.867
+0.2
0.31%
1 Jan 1973 Jahr
65.214
+1.347
2.11%
1 Jan 1974 Jahr
73.962
+8.748
13.41%
1 Jan 1975 Jahr
56.861
-17.101
-23.12%
1 Jan 1976 Jahr
62.666
+5.804
10.21%
1 Jan 1977 Jahr
58.296
-4.369
-6.97%
1 Jan 1978 Jahr
66.298
+8.002
13.73%
1 Jan 1979 Jahr
63.287
-3.011
-4.54%
1 Jan 1980 Jahr
61.436
-1.851
-2.93%
1 Jan 1981 Jahr
59.585
-1.851
-3.01%
1 Jan 1982 Jahr
64.784
+5.199
8.73%
1 Jan 1983 Jahr
61.068
-3.716
-5.74%
1 Jan 1984 Jahr
61.859
+0.79
1.29%
1 Jan 1985 Jahr
61.964
+0.105
0.17%
1 Jan 1986 Jahr
60.387
-1.577
-2.54%
1 Jan 1987 Jahr
67.49
+7.103
11.76%
1 Jan 1988 Jahr
65.369
-2.121
-3.14%
1 Jan 1989 Jahr
63.829
-1.54
-2.36%
1 Jan 1990 Jahr
67.76
+3.932
6.16%
1 Jan 1991 Jahr
76.854
+9.094
13.42%
1 Jan 1992 Jahr
75.772
-1.083
-1.41%
1 Jan 1993 Jahr
72.03
-3.741
-4.94%
1 Jan 1994 Jahr
75.129
+3.099
4.3%
1 Jan 1995 Jahr
75.556
+0.426
0.57%
1 Jan 1996 Jahr
73.732
-1.823
-2.41%
1 Jan 1997 Jahr
67.493
-6.239
-8.46%
1 Jan 1998 Jahr
69.33
+1.836
2.72%
1 Jan 1999 Jahr
70.221
+0.891
1.29%
1 Jan 2000 Jahr
70.422
+0.201
0.29%
1 Jan 2001 Jahr
66.173
-4.249
-6.03%
1 Jan 2002 Jahr
67.699
+1.526
2.31%
1 Jan 2003 Jahr
68.534
+0.835
1.23%
1 Jan 2004 Jahr
68.252
-0.282
-0.41%
1 Jan 2005 Jahr
70.512
+2.261
3.31%
1 Jan 2006 Jahr
73.066
+2.554
3.62%
1 Jan 2007 Jahr
76.139
+3.072
4.2%
1 Jan 2008 Jahr
78.336
+2.197
2.89%
1 Jan 2009 Jahr
76.742
-1.594
-2.04%
1 Jan 2010 Jahr
75.807
-0.934
-1.22%
1 Jan 2011 Jahr
79.365
+3.558
4.69%
1 Jan 2012 Jahr
77.938
-1.428
-1.8%
1 Jan 2013 Jahr
74.496
-3.442
-4.42%
1 Jan 2014 Jahr
76.282
+1.786
2.4%
1 Jan 2015 Jahr
74.657
-1.625
-2.13%
1 Jan 2016 Jahr
75.634
+0.977
1.31%
Bewertung der Länder gemäß mit laufender Statistik nach Jahren


Kommentare: