29
/de/
de
AIzaSyAYiBZKx7MnpbEhh9jyipgxe19OcubqV5w
April 1, 2024
101315
Canada
CAN
true
2
1
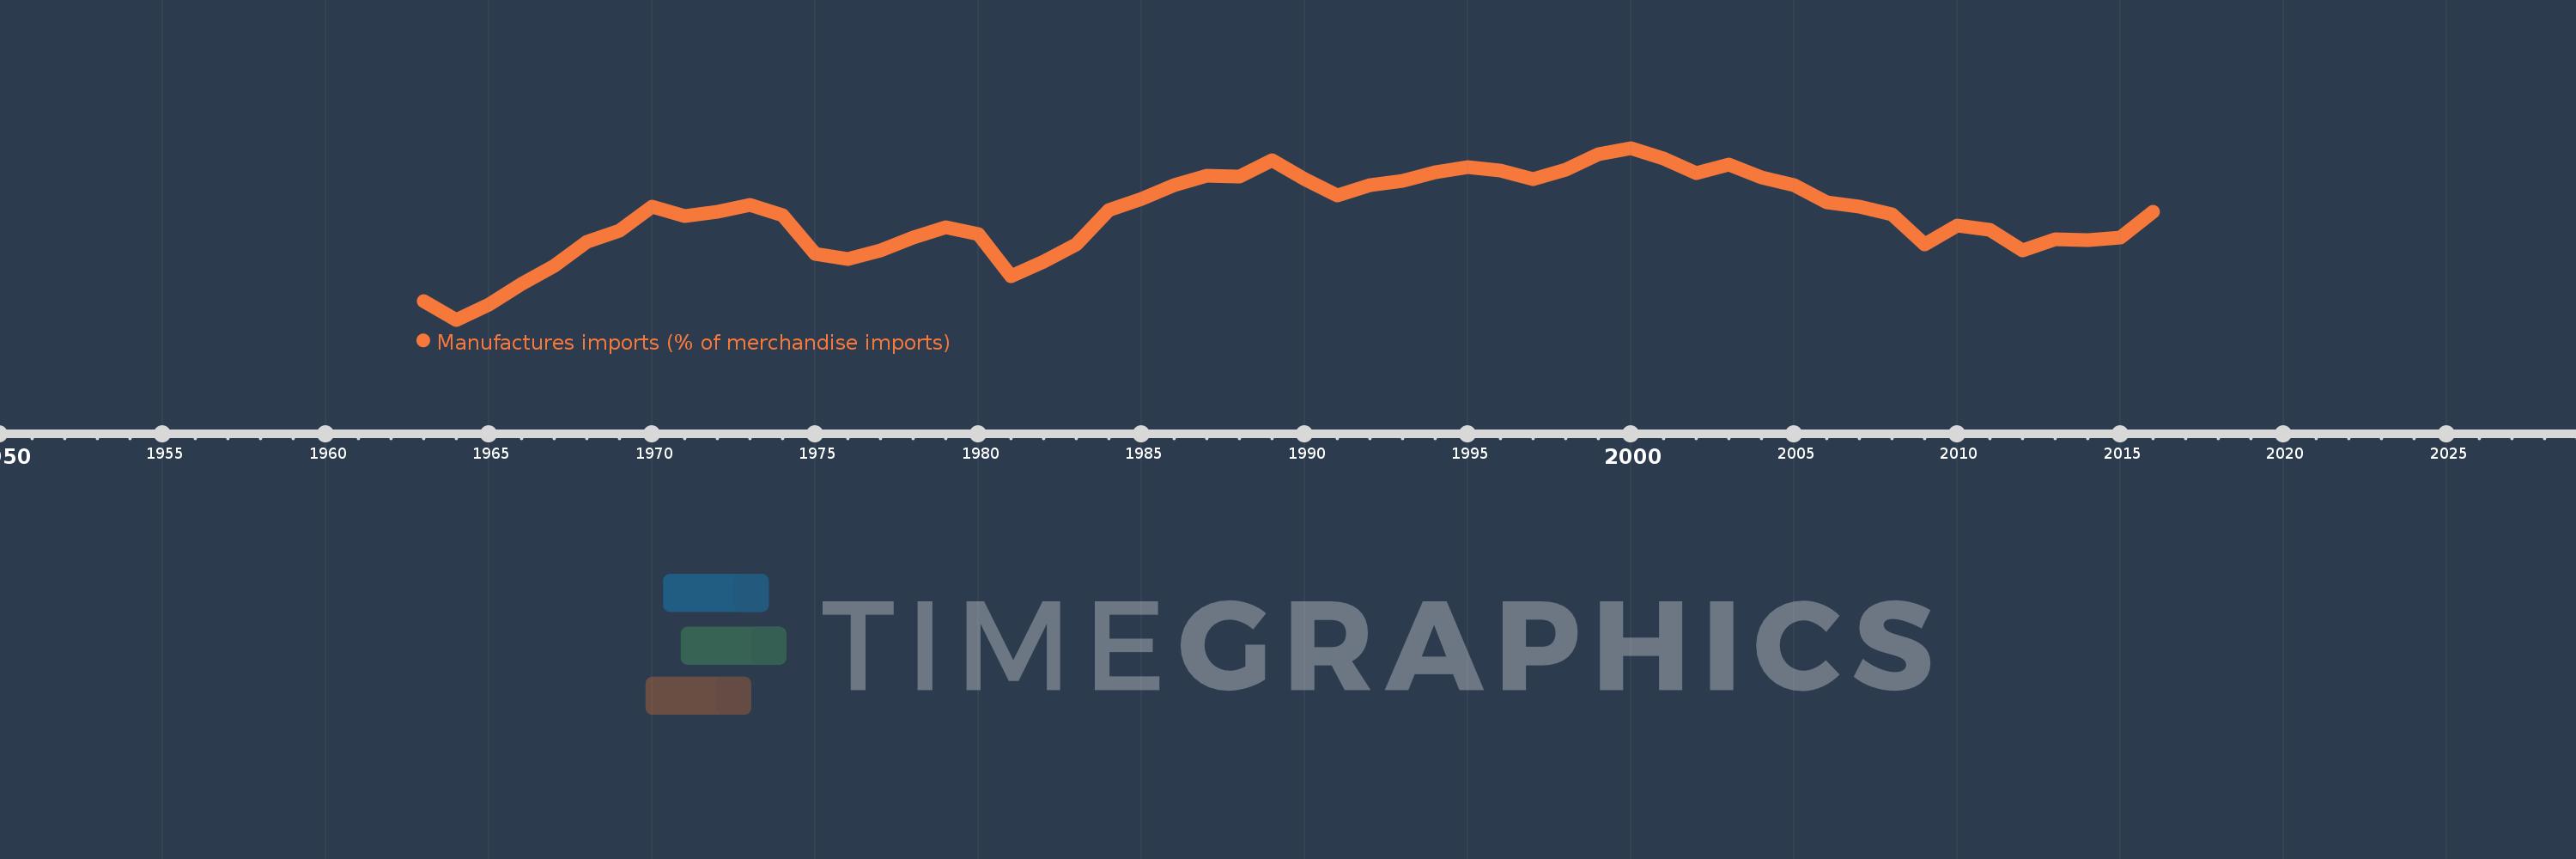
Manufactures imports (% of merchandise imports)
2016,2015,2014,2013,2012,2011,2010,2009,2008,2007,2006,2005,2004,2003,2002,2001,2000,1999,1998,1997,1996,1995,1994,1993,1992,1991,1990,1989,1988,1987,1986,1985,1984,1983,1982,1981,1980,1979,1978,1977,1976,1975,1974,1973,1972,1971,1970,1969,1968,1967,1966,1965,1964,1963
Diese Statistik in anderen Ländern:
AfghanistanAlbaniaAlgeriaAndorraAngolaAntigua and BarbudaArab WorldArgentinaArmeniaArubaAustraliaAustriaAzerbaijanBahamas, TheBahrainBangladeshBarbadosBelarusBelgiumBelizeBeninBermudaBhutanBoliviaBosnia and HerzegovinaBotswanaBrazilBrunei DarussalamBulgariaBurkina FasoBurundiCabo VerdeCambodiaCameroonCanadaCaribbean small statesCayman IslandsCentral African RepublicCentral Europe and the BalticsChadChileChinaColombiaComorosCongo, Dem. Rep.Congo, Rep.Costa RicaCote d'IvoireCroatiaCubaCyprusCzech RepublicDenmarkDjiboutiDominicaDominican RepublicEarly-demographic dividendEast Asia & PacificEast Asia & Pacific (excluding high income)East Asia & Pacific (IDA & IBRD countries)EcuadorEgypt, Arab Rep.El SalvadorEquatorial GuineaEritreaEstoniaEthiopiaEuro areaEurope & Central AsiaEurope & Central Asia (excluding high income)Europe & Central Asia (IDA & IBRD countries)European UnionFaroe IslandsFijiFinlandFragile and conflict affected situationsFranceFrench PolynesiaGabonGambia, TheGeorgiaGermanyGhanaGreeceGreenlandGrenadaGuatemalaGuineaGuinea-BissauGuyanaHaitiHeavily indebted poor countries (HIPC)High incomeHondurasHong Kong SAR, ChinaHungaryIBRD onlyIcelandIDA & IBRD totalIDA blendIDA onlyIDA totalIndiaIndonesiaIran, Islamic Rep.IraqIrelandIsraelItalyJamaicaJapanJordanKazakhstanKenyaKiribatiKorea, Rep.KuwaitKyrgyz RepublicLao PDRLate-demographic dividendLatin America & Caribbean Latin America & Caribbean (excluding high income)Latin America & the Caribbean (IDA & IBRD countries)LatviaLeast developed countries: UN classificationLebanonLesothoLiberiaLibyaLithuaniaLow & middle incomeLow incomeLower middle incomeLuxembourgMacao SAR, ChinaMacedonia, FYRMadagascarMalawiMalaysiaMaldivesMaliMaltaMauritaniaMauritiusMexicoMiddle East & North AfricaMiddle East & North Africa (excluding high income)Middle East & North Africa (IDA & IBRD countries)Middle incomeMoldovaMongoliaMoroccoMozambiqueMyanmarNamibiaNepalNetherlandsNew CaledoniaNew ZealandNicaraguaNigerNigeriaNorth AmericaNorwayOECD membersOmanOther small statesPacific island small statesPakistanPalauPanamaPapua New GuineaParaguayPeruPhilippinesPolandPortugalPost-demographic dividendPre-demographic dividendQatarRomaniaRussian FederationRwandaSamoaSao Tome and PrincipeSaudi ArabiaSenegalSerbiaSeychellesSierra LeoneSingaporeSlovak RepublicSloveniaSmall statesSolomon IslandsSomaliaSouth AfricaSouth AsiaSouth Asia (IDA & IBRD)SpainSri LankaSt. Kitts and NevisSt. LuciaSt. Vincent and the GrenadinesSub-Saharan Africa Sub-Saharan Africa (excluding high income)Sub-Saharan Africa (IDA & IBRD countries)SudanSurinameSwazilandSwedenSwitzerlandSyrian Arab RepublicTajikistanTanzaniaThailandTimor-LesteTogoTongaTrinidad and TobagoTunisiaTurkeyTurkmenistanTurks and Caicos IslandsTuvaluUgandaUkraineUnited Arab EmiratesUnited KingdomUnited StatesUpper middle incomeUruguayVanuatuVenezuela, RBVietnamVirgin Islands (U.S.)WorldYemen, Rep.ZambiaZimbabwe Zeitlinie:
Diese Zeitleiste vorliegt die Graphik ab 1963 J. bis 2016 J. Canada. Die Angaben bis 1962 J. sind nicht vorhanden. Die Zahl aktueller Beobachtungen nach Daten: 54.
Die Quelle (Bezeichnung):
Kennzahlen der Weltentwicklung
Die Quelle (Einrichtung):
World Bank staff estimates from the Comtrade database maintained by the United Nations Statistics Division.
Kategorien:
Private Sector, Trade
Es wurde aktualisiert:
23 Apr 2017 Jahr
Kennzahlen der Wertänderungen vom Jahr zum Jahr
Minimum:
66.902
1 Jan 1964 Jahr
Maximum:
85.666
1 Jan 2000 Jahr
Zum Datum der Beobachtung
Wert
Absolute Veränderung
Die Veränderung bezüglich dem vorherigen Wert
1 Jan 1963 Jahr
68.95
+68.95
0.0%
1 Jan 1964 Jahr
66.902
-2.048
-2.97%
1 Jan 1965 Jahr
68.538
+1.635
2.44%
1 Jan 1966 Jahr
70.793
+2.255
3.29%
1 Jan 1967 Jahr
72.825
+2.032
2.87%
1 Jan 1968 Jahr
75.366
+2.541
3.49%
1 Jan 1969 Jahr
76.599
+1.233
1.64%
1 Jan 1970 Jahr
79.22
+2.621
3.42%
1 Jan 1971 Jahr
78.232
-0.988
-1.25%
1 Jan 1972 Jahr
78.722
+0.49
0.63%
1 Jan 1973 Jahr
79.453
+0.731
0.93%
1 Jan 1974 Jahr
78.323
-1.13
-1.42%
1 Jan 1975 Jahr
74.123
-4.2
-5.36%
1 Jan 1976 Jahr
73.581
-0.542
-0.73%
1 Jan 1977 Jahr
74.503
+0.923
1.25%
1 Jan 1978 Jahr
75.851
+1.348
1.81%
1 Jan 1979 Jahr
76.962
+1.111
1.47%
1 Jan 1980 Jahr
76.242
-0.72
-0.94%
1 Jan 1981 Jahr
71.651
-4.591
-6.02%
1 Jan 1982 Jahr
73.209
+1.558
2.17%
1 Jan 1983 Jahr
75.098
+1.889
2.58%
1 Jan 1984 Jahr
78.867
+3.77
5.02%
1 Jan 1985 Jahr
80.065
+1.197
1.52%
1 Jan 1986 Jahr
81.637
+1.572
1.96%
1 Jan 1987 Jahr
82.599
+0.962
1.18%
1 Jan 1988 Jahr
82.521
-0.078
-0.09%
1 Jan 1989 Jahr
84.29
+1.769
2.14%
1 Jan 1990 Jahr
82.233
-2.057
-2.44%
1 Jan 1991 Jahr
80.507
-1.726
-2.1%
1 Jan 1992 Jahr
81.625
+1.118
1.39%
1 Jan 1993 Jahr
82.072
+0.447
0.55%
1 Jan 1994 Jahr
82.983
+0.912
1.11%
1 Jan 1995 Jahr
83.565
+0.582
0.7%
1 Jan 1996 Jahr
83.245
-0.321
-0.38%
1 Jan 1997 Jahr
82.266
-0.978
-1.18%
1 Jan 1998 Jahr
83.247
+0.98
1.19%
1 Jan 1999 Jahr
85.001
+1.754
2.11%
1 Jan 2000 Jahr
85.666
+0.665
0.78%
1 Jan 2001 Jahr
84.548
-1.118
-1.3%
1 Jan 2002 Jahr
82.887
-1.661
-1.96%
1 Jan 2003 Jahr
83.897
+1.01
1.22%
1 Jan 2004 Jahr
82.409
-1.488
-1.77%
1 Jan 2005 Jahr
81.586
-0.823
-1.0%
1 Jan 2006 Jahr
79.707
-1.879
-2.3%
1 Jan 2007 Jahr
79.246
-0.461
-0.58%
1 Jan 2008 Jahr
78.453
-0.793
-1.0%
1 Jan 2009 Jahr
75.168
-3.285
-4.19%
1 Jan 2010 Jahr
77.189
+2.021
2.69%
1 Jan 2011 Jahr
76.679
-0.51
-0.66%
1 Jan 2012 Jahr
74.43
-2.249
-2.93%
1 Jan 2013 Jahr
75.689
+1.259
1.69%
1 Jan 2014 Jahr
75.634
-0.055
-0.07%
1 Jan 2015 Jahr
75.89
+0.256
0.34%
1 Jan 2016 Jahr
78.718
+2.828
3.73%
Bewertung der Länder gemäß mit laufender Statistik nach Jahren


Kommentare: