29
/de/
de
AIzaSyAYiBZKx7MnpbEhh9jyipgxe19OcubqV5w
April 1, 2024
205563
Namibia
NAM
true
2
1
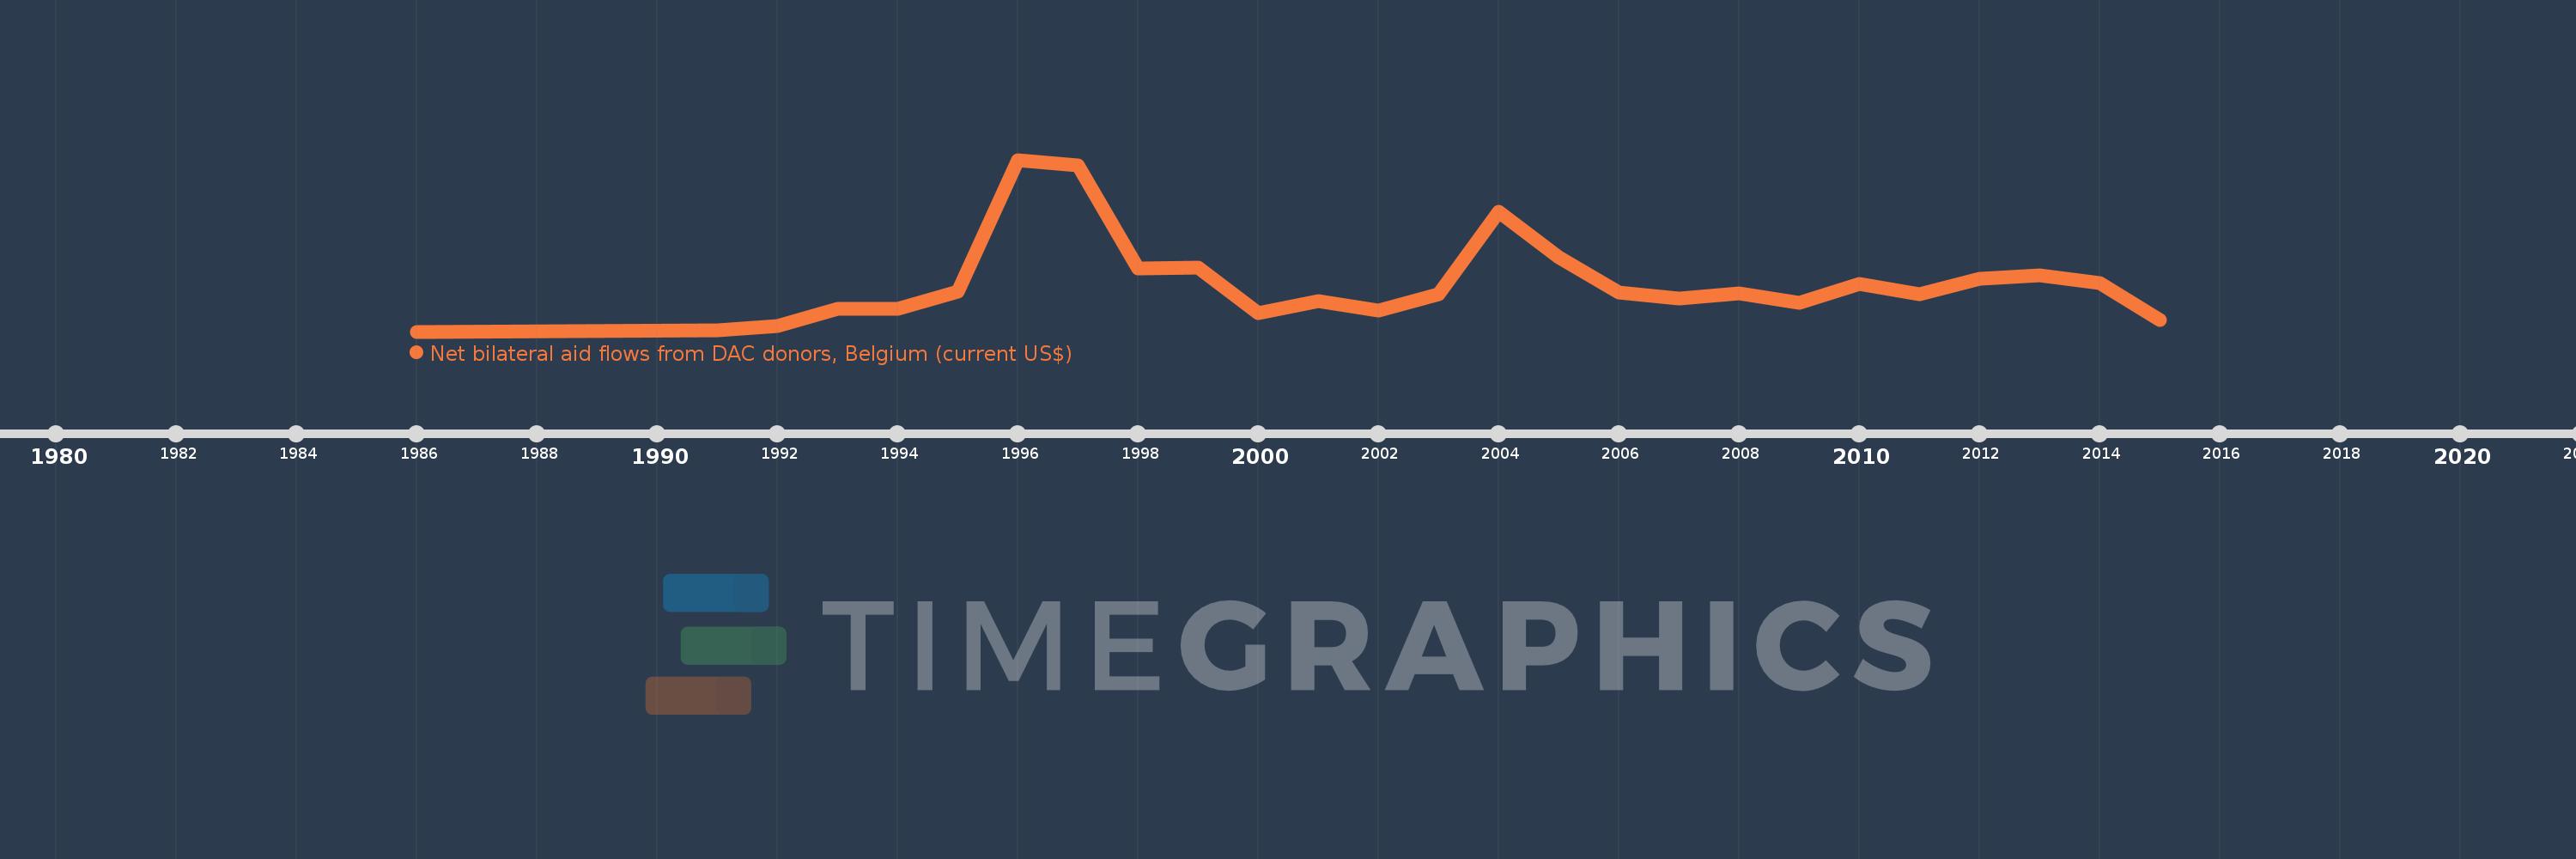
Net bilateral aid flows from DAC donors, Belgium (current US$)
2015,2014,2013,2012,2011,2010,2009,2008,2007,2006,2005,2004,2003,2002,2001,2000,1999,1998,1997,1996,1995,1994,1993,1992,1991,1986
Diese Statistik in anderen Ländern:
AfghanistanAlbaniaAlgeriaAngolaAntigua and BarbudaArab WorldArgentinaArmeniaArubaAzerbaijanBahamas, TheBahrainBangladeshBarbadosBelarusBelizeBeninBhutanBoliviaBosnia and HerzegovinaBotswanaBrazilBritish Virgin IslandsBulgariaBurkina FasoBurundiCabo VerdeCambodiaCameroonCaribbean small statesCentral African RepublicCentral Europe and the BalticsChadChileChinaColombiaComorosCongo, Dem. Rep.Congo, Rep.Costa RicaCote d'IvoireCroatiaCubaCyprusCzech RepublicDjiboutiDominicaDominican RepublicEast Asia & PacificEast Asia & Pacific (excluding high income)East Asia & Pacific (IDA & IBRD countries)EcuadorEgypt, Arab Rep.El SalvadorEquatorial GuineaEritreaEstoniaEthiopiaEuro areaEurope & Central AsiaEurope & Central Asia (excluding high income)Europe & Central Asia (IDA & IBRD countries)European UnionFijiFragile and conflict affected situationsGabonGambia, TheGeorgiaGhanaGrenadaGuatemalaGuineaGuinea-BissauGuyanaHaitiHeavily indebted poor countries (HIPC)High incomeHondurasHong Kong SAR, ChinaHungaryIBRD onlyIDA & IBRD totalIDA blendIDA onlyIDA totalIndiaIndonesiaIran, Islamic Rep.IraqIsraelJamaicaJordanKazakhstanKenyaKorea, Dem. People’s Rep.Korea, Rep.KosovoKuwaitKyrgyz RepublicLao PDRLatin America & Caribbean Latin America & Caribbean (excluding high income)Latin America & the Caribbean (IDA & IBRD countries)LatviaLeast developed countries: UN classificationLebanonLesothoLiberiaLibyaLithuaniaLow & middle incomeLow incomeLower middle incomeMacedonia, FYRMadagascarMalawiMalaysiaMaldivesMaliMaltaMarshall IslandsMauritaniaMauritiusMexicoMiddle East & North AfricaMiddle East & North Africa (excluding high income)Middle East & North Africa (IDA & IBRD countries)Middle incomeMoldovaMongoliaMontenegroMoroccoMozambiqueMyanmarNamibiaNepalNew CaledoniaNicaraguaNigerNigeriaNorthern Mariana IslandsOECD membersOmanOther small statesPacific island small statesPakistanPanamaPapua New GuineaParaguayPeruPhilippinesPolandRomaniaRussian FederationRwandaSamoaSao Tome and PrincipeSaudi ArabiaSenegalSerbiaSeychellesSierra LeoneSingaporeSlovak RepublicSloveniaSmall statesSolomon IslandsSomaliaSouth AfricaSouth AsiaSouth Asia (IDA & IBRD)South SudanSri LankaSt. LuciaSt. Vincent and the GrenadinesSub-Saharan Africa Sub-Saharan Africa (excluding high income)Sub-Saharan Africa (IDA & IBRD countries)SudanSurinameSwazilandSyrian Arab RepublicTajikistanTanzaniaThailandTimor-LesteTogoTongaTrinidad and TobagoTunisiaTurkeyTurkmenistanUgandaUkraineUnited Arab EmiratesUpper middle incomeUruguayUzbekistanVanuatuVenezuela, RBVietnamWest Bank and GazaWorldYemen, Rep.ZambiaZimbabwe Zeitlinie:
Diese Zeitleiste vorliegt die Graphik ab 1986 J. bis 2015 J. Namibia. Die Angaben bis 1985 J. sind nicht vorhanden. Die Zahl aktueller Beobachtungen nach Daten: 26.
Die Quelle (Bezeichnung):
Kennzahlen der Weltentwicklung
Die Quelle (Einrichtung):
Development Assistance Committee of the Organisation for Economic Co-operation and Development, Geographical Distribution of Financial Flows to Developing Countries, Development Co-operation Report, and International Development Statistics database. Data are available online at: www.oecd.org/dac/stats/idsonline.
Kategorien:
Aid Effectiveness
Es wurde aktualisiert:
23 Apr 2017 Jahr
Kennzahlen der Wertänderungen vom Jahr zum Jahr
im Durchschnitt:
729.615 Tsnd.
Minimum:
40.0 Tsnd.
1 Jan 1986 Jahr
Maximum:
2.5 Mln.
1 Jan 1996 Jahr
Zum Datum der Beobachtung
Wert
Absolute Veränderung
Die Veränderung bezüglich dem vorherigen Wert
1 Jan 1986 Jahr
40.0 Tsnd.
+40.0 Tsnd.
0.0%
1 Jan 1991 Jahr
60.0 Tsnd.
+20.0 Tsnd.
50.0%
1 Jan 1992 Jahr
120.0 Tsnd.
+60.0 Tsnd.
100.0%
1 Jan 1993 Jahr
360.0 Tsnd.
+240.0 Tsnd.
200.0%
1 Jan 1994 Jahr
370.0 Tsnd.
+10.0 Tsnd.
2.78%
1 Jan 1995 Jahr
610.0 Tsnd.
+240.0 Tsnd.
64.86%
1 Jan 1996 Jahr
2.5 Mln.
+1.89 Mln.
309.84%
1 Jan 1997 Jahr
2.42 Mln.
-80.0 Tsnd.
-3.2%
1 Jan 1998 Jahr
950.0 Tsnd.
-1.47 Mln.
-60.74%
1 Jan 1999 Jahr
960.0 Tsnd.
+10.0 Tsnd.
1.05%
1 Jan 2000 Jahr
310.0 Tsnd.
-650.0 Tsnd.
-67.71%
1 Jan 2001 Jahr
480.0 Tsnd.
+170.0 Tsnd.
54.84%
1 Jan 2002 Jahr
340.0 Tsnd.
-140.0 Tsnd.
-29.17%
1 Jan 2003 Jahr
570.0 Tsnd.
+230.0 Tsnd.
67.65%
1 Jan 2004 Jahr
1.75 Mln.
+1.18 Mln.
207.02%
1 Jan 2005 Jahr
1.11 Mln.
-640.0 Tsnd.
-36.57%
1 Jan 2006 Jahr
600.0 Tsnd.
-510.0 Tsnd.
-45.95%
1 Jan 2007 Jahr
510.0 Tsnd.
-90.0 Tsnd.
-15.0%
1 Jan 2008 Jahr
590.0 Tsnd.
+80.0 Tsnd.
15.69%
1 Jan 2009 Jahr
450.0 Tsnd.
-140.0 Tsnd.
-23.73%
1 Jan 2010 Jahr
720.0 Tsnd.
+270.0 Tsnd.
60.0%
1 Jan 2011 Jahr
570.0 Tsnd.
-150.0 Tsnd.
-20.83%
1 Jan 2012 Jahr
800.0 Tsnd.
+230.0 Tsnd.
40.35%
1 Jan 2013 Jahr
850.0 Tsnd.
+50.0 Tsnd.
6.25%
1 Jan 2014 Jahr
730.0 Tsnd.
-120.0 Tsnd.
-14.12%
1 Jan 2015 Jahr
200.0 Tsnd.
-530.0 Tsnd.
-72.6%
Bewertung der Länder gemäß mit laufender Statistik nach Jahren


Kommentare: