29
/de/
de
AIzaSyAYiBZKx7MnpbEhh9jyipgxe19OcubqV5w
April 1, 2024
106286
China
CHN
true
2
1
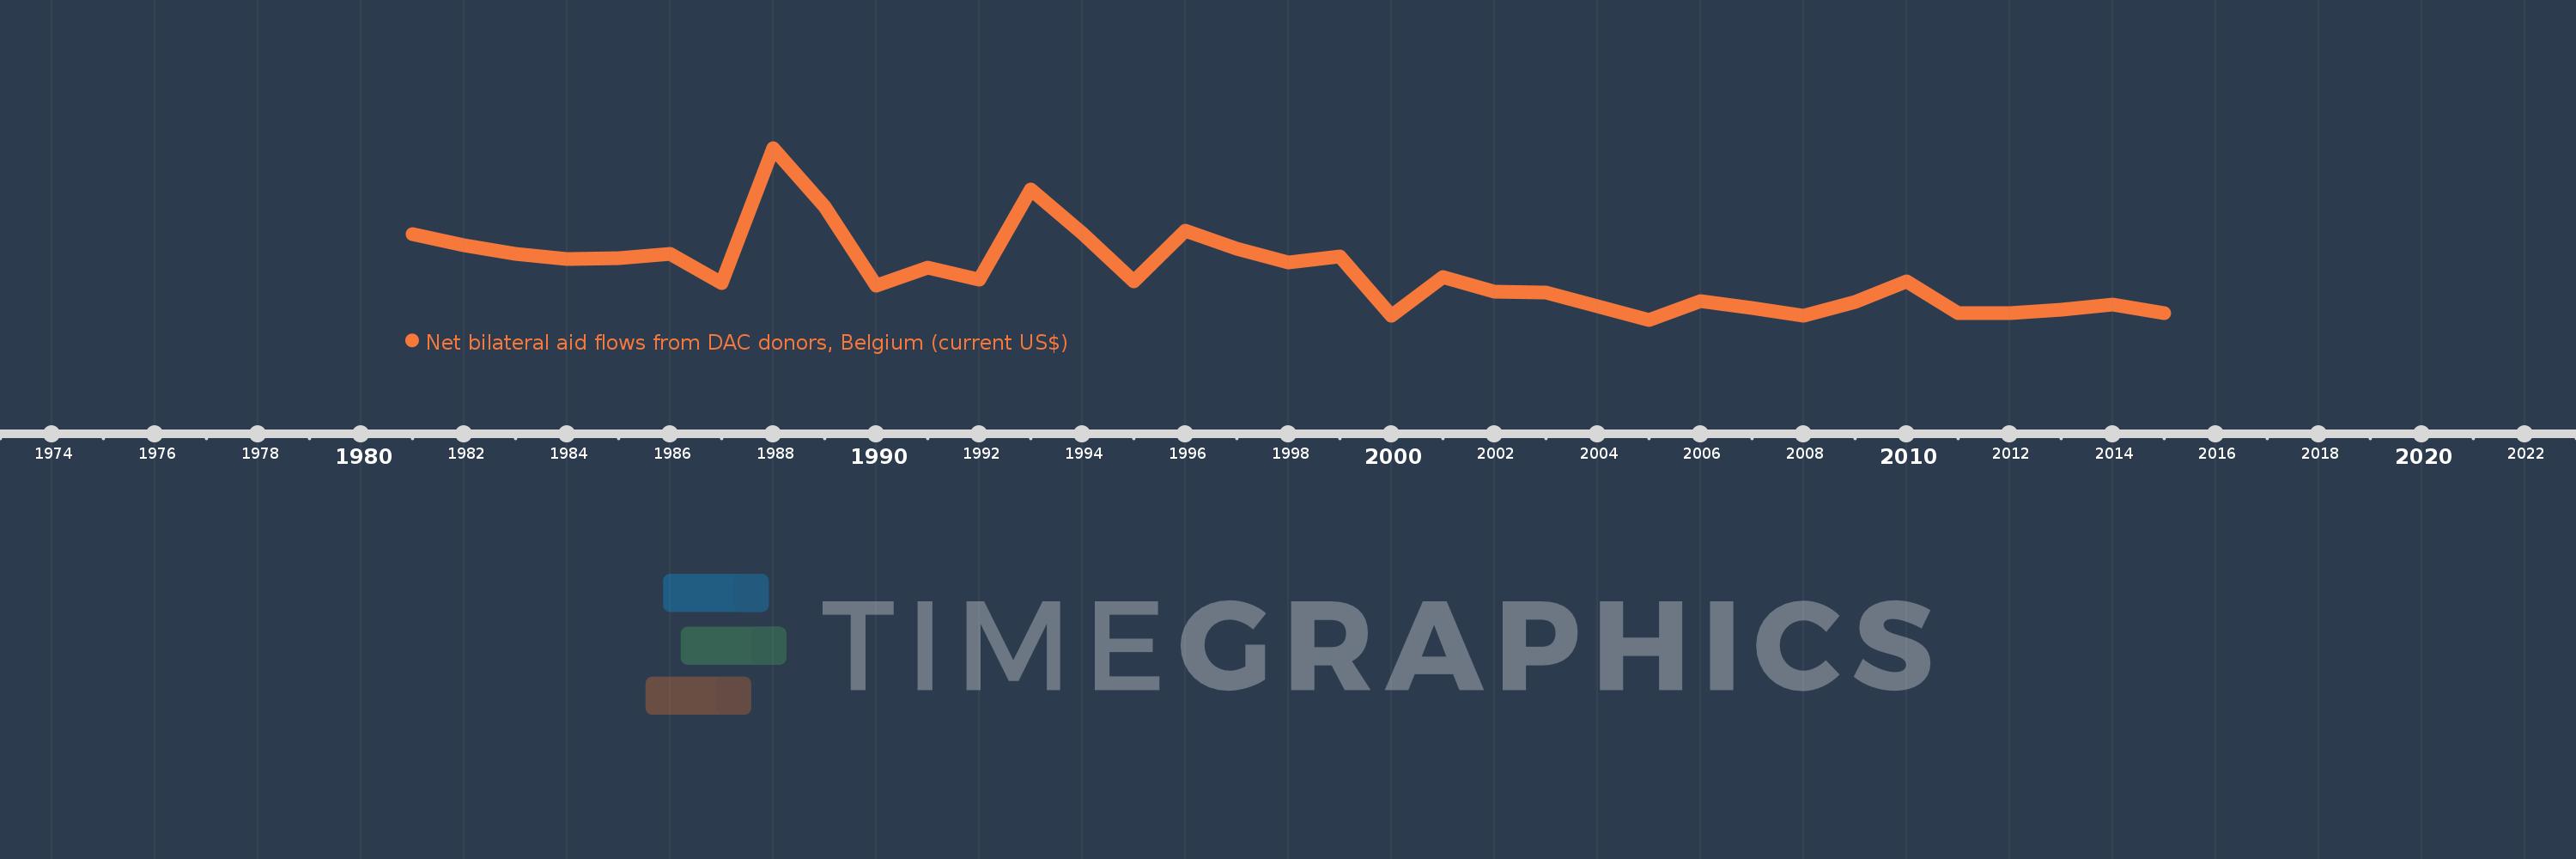
Net bilateral aid flows from DAC donors, Belgium (current US$)
2015,2014,2013,2012,2011,2010,2009,2008,2007,2006,2005,2004,2003,2002,2001,2000,1999,1998,1997,1996,1995,1994,1993,1992,1991,1990,1989,1988,1987,1986,1985,1984,1983,1982,1981
Diese Statistik in anderen Ländern:
AfghanistanAlbaniaAlgeriaAngolaAntigua and BarbudaArab WorldArgentinaArmeniaArubaAzerbaijanBahamas, TheBahrainBangladeshBarbadosBelarusBelizeBeninBhutanBoliviaBosnia and HerzegovinaBotswanaBrazilBritish Virgin IslandsBulgariaBurkina FasoBurundiCabo VerdeCambodiaCameroonCaribbean small statesCentral African RepublicCentral Europe and the BalticsChadChileChinaColombiaComorosCongo, Dem. Rep.Congo, Rep.Costa RicaCote d'IvoireCroatiaCubaCyprusCzech RepublicDjiboutiDominicaDominican RepublicEast Asia & PacificEast Asia & Pacific (excluding high income)East Asia & Pacific (IDA & IBRD countries)EcuadorEgypt, Arab Rep.El SalvadorEquatorial GuineaEritreaEstoniaEthiopiaEuro areaEurope & Central AsiaEurope & Central Asia (excluding high income)Europe & Central Asia (IDA & IBRD countries)European UnionFijiFragile and conflict affected situationsGabonGambia, TheGeorgiaGhanaGrenadaGuatemalaGuineaGuinea-BissauGuyanaHaitiHeavily indebted poor countries (HIPC)High incomeHondurasHong Kong SAR, ChinaHungaryIBRD onlyIDA & IBRD totalIDA blendIDA onlyIDA totalIndiaIndonesiaIran, Islamic Rep.IraqIsraelJamaicaJordanKazakhstanKenyaKorea, Dem. People’s Rep.Korea, Rep.KosovoKuwaitKyrgyz RepublicLao PDRLatin America & Caribbean Latin America & Caribbean (excluding high income)Latin America & the Caribbean (IDA & IBRD countries)LatviaLeast developed countries: UN classificationLebanonLesothoLiberiaLibyaLithuaniaLow & middle incomeLow incomeLower middle incomeMacedonia, FYRMadagascarMalawiMalaysiaMaldivesMaliMaltaMarshall IslandsMauritaniaMauritiusMexicoMiddle East & North AfricaMiddle East & North Africa (excluding high income)Middle East & North Africa (IDA & IBRD countries)Middle incomeMoldovaMongoliaMontenegroMoroccoMozambiqueMyanmarNamibiaNepalNew CaledoniaNicaraguaNigerNigeriaNorthern Mariana IslandsOECD membersOmanOther small statesPacific island small statesPakistanPanamaPapua New GuineaParaguayPeruPhilippinesPolandRomaniaRussian FederationRwandaSamoaSao Tome and PrincipeSaudi ArabiaSenegalSerbiaSeychellesSierra LeoneSingaporeSlovak RepublicSloveniaSmall statesSolomon IslandsSomaliaSouth AfricaSouth AsiaSouth Asia (IDA & IBRD)South SudanSri LankaSt. LuciaSt. Vincent and the GrenadinesSub-Saharan Africa Sub-Saharan Africa (excluding high income)Sub-Saharan Africa (IDA & IBRD countries)SudanSurinameSwazilandSyrian Arab RepublicTajikistanTanzaniaThailandTimor-LesteTogoTongaTrinidad and TobagoTunisiaTurkeyTurkmenistanUgandaUkraineUnited Arab EmiratesUpper middle incomeUruguayUzbekistanVanuatuVenezuela, RBVietnamWest Bank and GazaWorldYemen, Rep.ZambiaZimbabwe Zeitlinie:
Diese Zeitleiste vorliegt die Graphik ab 1981 J. bis 2015 J. China. Die Angaben bis 1980 J. sind nicht vorhanden. Die Zahl aktueller Beobachtungen nach Daten: 35.
Die Quelle (Bezeichnung):
Kennzahlen der Weltentwicklung
Die Quelle (Einrichtung):
Development Assistance Committee of the Organisation for Economic Co-operation and Development, Geographical Distribution of Financial Flows to Developing Countries, Development Co-operation Report, and International Development Statistics database. Data are available online at: www.oecd.org/dac/stats/idsonline.
Kategorien:
Aid Effectiveness
Es wurde aktualisiert:
23 Apr 2017 Jahr
Kennzahlen der Wertänderungen vom Jahr zum Jahr
im Durchschnitt:
3.62 Mln.
Minimum:
-4.59 Mln.
1 Jan 2005 Jahr
Maximum:
25.32 Mln.
1 Jan 1988 Jahr
Zum Datum der Beobachtung
Wert
Absolute Veränderung
Die Veränderung bezüglich dem vorherigen Wert
1 Jan 1981 Jahr
10.38 Mln.
+10.38 Mln.
0.0%
1 Jan 1982 Jahr
8.43 Mln.
-1.95 Mln.
-18.79%
1 Jan 1983 Jahr
6.93 Mln.
-1.5 Mln.
-17.79%
1 Jan 1984 Jahr
6.03 Mln.
-900.0 Tsnd.
-12.99%
1 Jan 1985 Jahr
6.19 Mln.
+160.0 Tsnd.
2.65%
1 Jan 1986 Jahr
6.87 Mln.
+680.0 Tsnd.
10.99%
1 Jan 1987 Jahr
1.78 Mln.
-5.09 Mln.
-74.09%
1 Jan 1988 Jahr
25.32 Mln.
+23.54 Mln.
1.32 Tsnd.%
1 Jan 1989 Jahr
15.13 Mln.
-10.19 Mln.
-40.24%
1 Jan 1990 Jahr
1.31 Mln.
-13.82 Mln.
-91.34%
1 Jan 1991 Jahr
4.53 Mln.
+3.22 Mln.
245.8%
1 Jan 1992 Jahr
2.33 Mln.
-2.2 Mln.
-48.57%
1 Jan 1993 Jahr
18.14 Mln.
+15.81 Mln.
678.54%
1 Jan 1994 Jahr
10.53 Mln.
-7.61 Mln.
-41.95%
1 Jan 1995 Jahr
2.09 Mln.
-8.44 Mln.
-80.15%
1 Jan 1996 Jahr
10.92 Mln.
+8.83 Mln.
422.49%
1 Jan 1997 Jahr
7.78 Mln.
-3.14 Mln.
-28.75%
1 Jan 1998 Jahr
5.34 Mln.
-2.44 Mln.
-31.36%
1 Jan 1999 Jahr
6.48 Mln.
+1.14 Mln.
21.35%
1 Jan 2000 Jahr
-3.82 Mln.
-10.3 Mln.
-158.95%
1 Jan 2001 Jahr
2.86 Mln.
+6.68 Mln.
-174.87%
1 Jan 2002 Jahr
320.0 Tsnd.
-2.54 Mln.
-88.81%
1 Jan 2003 Jahr
160.0 Tsnd.
-160.0 Tsnd.
-50.0%
1 Jan 2004 Jahr
-2.31 Mln.
-2.47 Mln.
-1.54 Tsnd.%
1 Jan 2005 Jahr
-4.59 Mln.
-2.28 Mln.
98.7%
1 Jan 2006 Jahr
-1.34 Mln.
+3.25 Mln.
-70.81%
1 Jan 2007 Jahr
-2.55 Mln.
-1.21 Mln.
90.3%
1 Jan 2008 Jahr
-3.84 Mln.
-1.29 Mln.
50.59%
1 Jan 2009 Jahr
-1.52 Mln.
+2.32 Mln.
-60.42%
1 Jan 2010 Jahr
2.05 Mln.
+3.57 Mln.
-234.87%
1 Jan 2011 Jahr
-3.38 Mln.
-5.43 Mln.
-264.88%
1 Jan 2012 Jahr
-3.51 Mln.
-130.0 Tsnd.
3.85%
1 Jan 2013 Jahr
-2.91 Mln.
+600.0 Tsnd.
-17.09%
1 Jan 2014 Jahr
-1.99 Mln.
+920.0 Tsnd.
-31.62%
1 Jan 2015 Jahr
-3.44 Mln.
-1.45 Mln.
72.86%
Bewertung der Länder gemäß mit laufender Statistik nach Jahren


Kommentare: