29
/de/
de
AIzaSyAYiBZKx7MnpbEhh9jyipgxe19OcubqV5w
April 1, 2024
191810
Malta
MLT
true
2
1
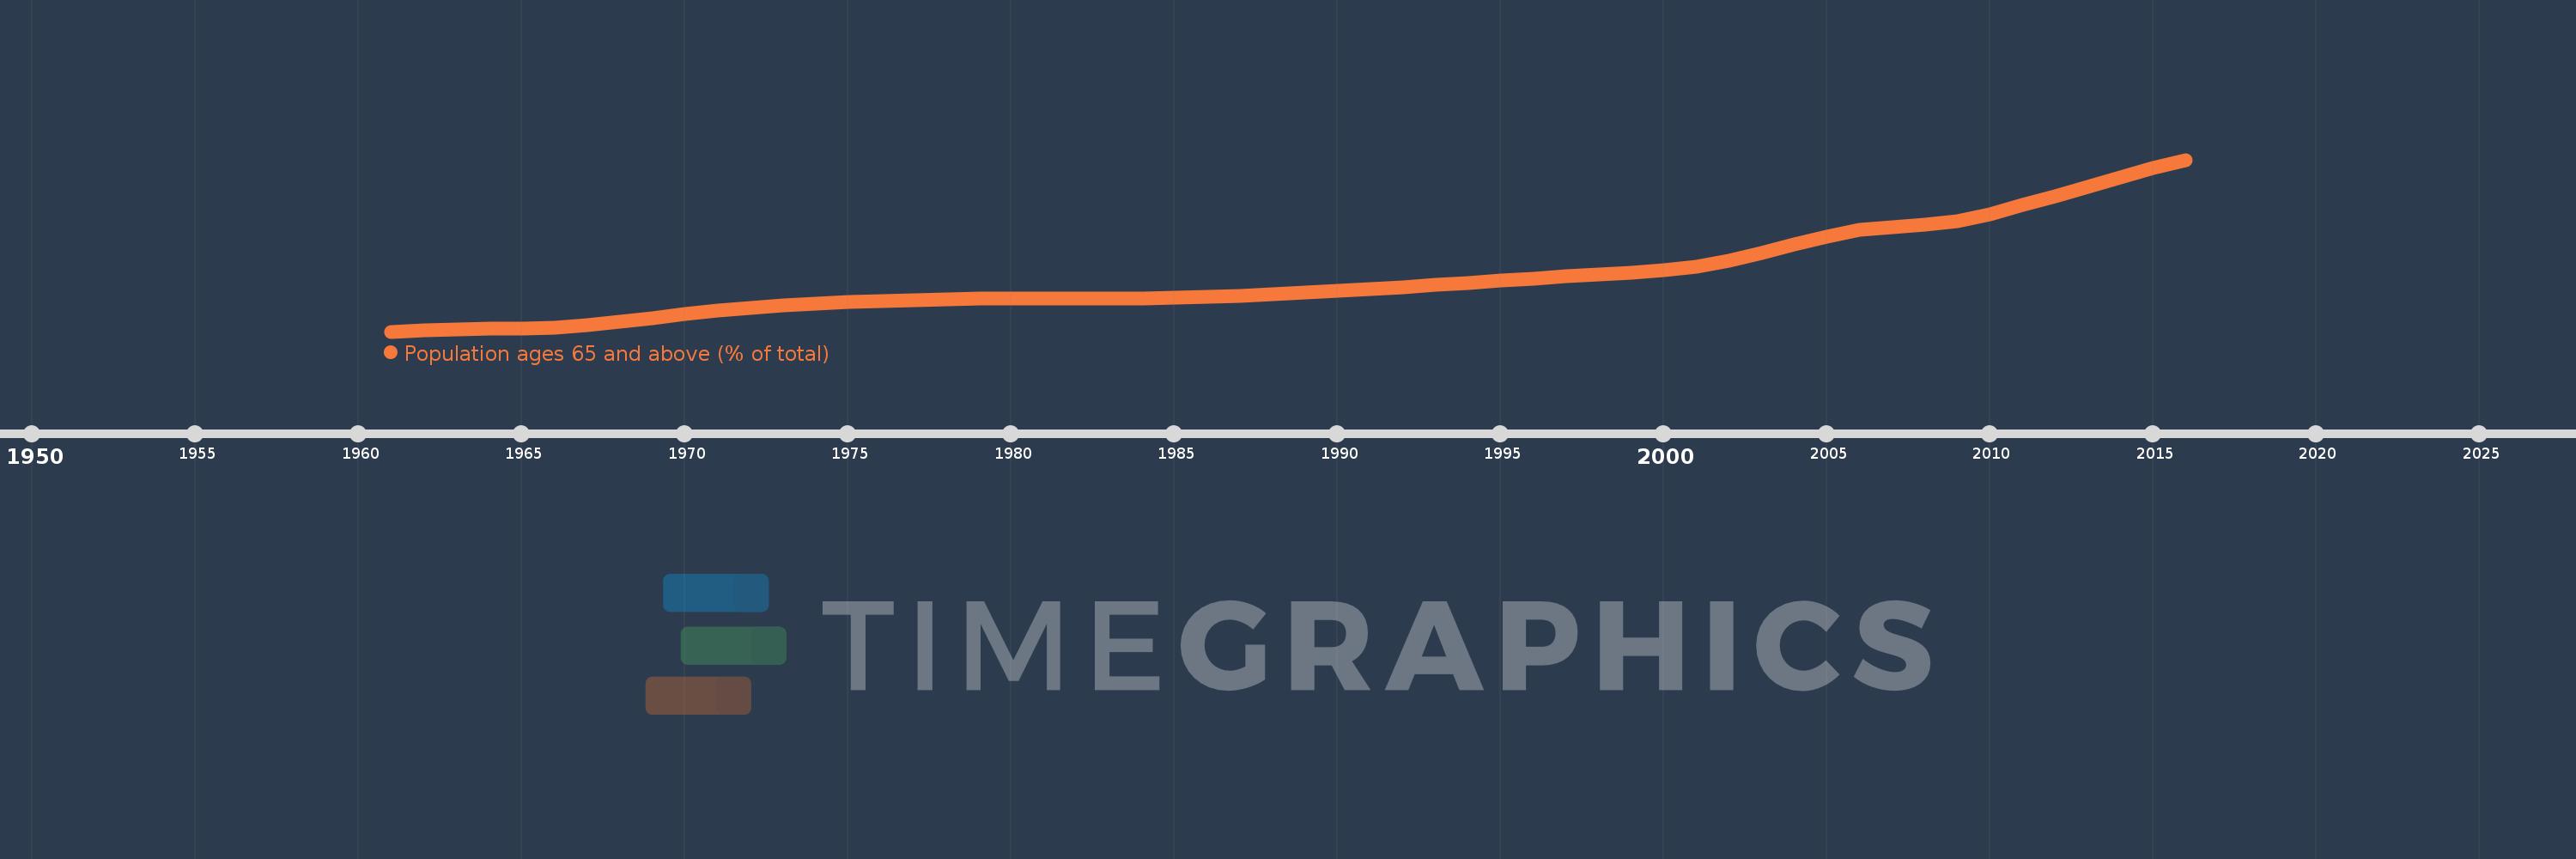
Population ages 65 and above (% of total)
2016,2015,2014,2013,2012,2011,2010,2009,2008,2007,2006,2005,2004,2003,2002,2001,2000,1999,1998,1997,1996,1995,1994,1993,1992,1991,1990,1989,1988,1987,1986,1985,1984,1983,1982,1981,1980,1979,1978,1977,1976,1975,1974,1973,1972,1971,1970,1969,1968,1967,1966,1965,1964,1963,1962,1961
Diese Statistik in anderen Ländern:
AfghanistanAlbaniaAlgeriaAngolaAntigua and BarbudaArab WorldArgentinaArmeniaArubaAustraliaAustriaAzerbaijanBahamas, TheBahrainBangladeshBarbadosBelarusBelgiumBelizeBeninBhutanBoliviaBosnia and HerzegovinaBotswanaBrazilBrunei DarussalamBulgariaBurkina FasoBurundiCabo VerdeCambodiaCameroonCanadaCaribbean small statesCentral African RepublicCentral Europe and the BalticsChadChannel IslandsChileChinaColombiaComorosCongo, Dem. Rep.Congo, Rep.Costa RicaCote d'IvoireCroatiaCubaCuracaoCyprusCzech RepublicDenmarkDjiboutiDominican RepublicEarly-demographic dividendEast Asia & PacificEast Asia & Pacific (excluding high income)East Asia & Pacific (IDA & IBRD countries)EcuadorEgypt, Arab Rep.El SalvadorEquatorial GuineaEritreaEstoniaEthiopiaEuro areaEurope & Central AsiaEurope & Central Asia (excluding high income)Europe & Central Asia (IDA & IBRD countries)European UnionFijiFinlandFragile and conflict affected situationsFranceFrench PolynesiaGabonGambia, TheGeorgiaGermanyGhanaGreeceGrenadaGuamGuatemalaGuineaGuinea-BissauGuyanaHaitiHeavily indebted poor countries (HIPC)High incomeHondurasHong Kong SAR, ChinaHungaryIBRD onlyIcelandIDA & IBRD totalIDA blendIDA onlyIDA totalIndiaIndonesiaIran, Islamic Rep.IraqIrelandIsraelItalyJamaicaJapanJordanKazakhstanKenyaKiribatiKorea, Dem. People’s Rep.Korea, Rep.KosovoKuwaitKyrgyz RepublicLao PDRLate-demographic dividendLatin America & Caribbean Latin America & Caribbean (excluding high income)Latin America & the Caribbean (IDA & IBRD countries)LatviaLeast developed countries: UN classificationLebanonLesothoLiberiaLibyaLithuaniaLow & middle incomeLow incomeLower middle incomeLuxembourgMacao SAR, ChinaMacedonia, FYRMadagascarMalawiMalaysiaMaldivesMaliMaltaMauritaniaMauritiusMexicoMicronesia, Fed. Sts.Middle East & North AfricaMiddle East & North Africa (excluding high income)Middle East & North Africa (IDA & IBRD countries)Middle incomeMoldovaMongoliaMontenegroMoroccoMozambiqueMyanmarNamibiaNepalNetherlandsNew CaledoniaNew ZealandNicaraguaNigerNigeriaNorth AmericaNorwayOECD membersOmanOther small statesPacific island small statesPakistanPanamaPapua New GuineaParaguayPeruPhilippinesPolandPortugalPost-demographic dividendPre-demographic dividendPuerto RicoQatarRomaniaRussian FederationRwandaSamoaSao Tome and PrincipeSaudi ArabiaSenegalSerbiaSeychellesSierra LeoneSingaporeSlovak RepublicSloveniaSmall statesSolomon IslandsSomaliaSouth AfricaSouth AsiaSouth Asia (IDA & IBRD)South SudanSpainSri LankaSt. LuciaSt. Vincent and the GrenadinesSub-Saharan Africa Sub-Saharan Africa (excluding high income)Sub-Saharan Africa (IDA & IBRD countries)SudanSurinameSwazilandSwedenSwitzerlandSyrian Arab RepublicTajikistanTanzaniaThailandTimor-LesteTogoTongaTrinidad and TobagoTunisiaTurkeyTurkmenistanUgandaUkraineUnited Arab EmiratesUnited KingdomUnited StatesUpper middle incomeUruguayUzbekistanVanuatuVenezuela, RBVietnamVirgin Islands (U.S.)West Bank and GazaWorldYemen, Rep.ZambiaZimbabwe Zeitlinie:
Diese Zeitleiste vorliegt die Graphik ab 1961 J. bis 2016 J. Malta. Die Angaben bis 1960 J. sind nicht vorhanden. Die Zahl aktueller Beobachtungen nach Daten: 56.
Die Quelle (Bezeichnung):
Kennzahlen der Weltentwicklung
Die Quelle (Einrichtung):
World Bank staff estimates based on age distributions of United Nations Population Division's World Population Prospects.
Kategorien:
Health
Es wurde aktualisiert:
23 Apr 2017 Jahr
Kennzahlen der Wertänderungen vom Jahr zum Jahr
Minimum:
6.989
1 Jan 1961 Jahr
Maximum:
19.248
1 Jan 2016 Jahr
Zum Datum der Beobachtung
Wert
Absolute Veränderung
Die Veränderung bezüglich dem vorherigen Wert
1 Jan 1961 Jahr
6.989
+6.989
0.0%
1 Jan 1962 Jahr
7.059
+0.07
1.0%
1 Jan 1963 Jahr
7.124
+0.065
0.91%
1 Jan 1964 Jahr
7.183
+0.059
0.83%
1 Jan 1965 Jahr
7.23
+0.046
0.65%
1 Jan 1966 Jahr
7.261
+0.032
0.44%
1 Jan 1967 Jahr
7.471
+0.21
2.89%
1 Jan 1968 Jahr
7.697
+0.226
3.03%
1 Jan 1969 Jahr
7.942
+0.245
3.18%
1 Jan 1970 Jahr
8.216
+0.273
3.44%
1 Jan 1971 Jahr
8.52
+0.304
3.7%
1 Jan 1972 Jahr
8.697
+0.178
2.08%
1 Jan 1973 Jahr
8.851
+0.154
1.77%
1 Jan 1974 Jahr
8.978
+0.127
1.43%
1 Jan 1975 Jahr
9.074
+0.096
1.07%
1 Jan 1976 Jahr
9.138
+0.064
0.7%
1 Jan 1977 Jahr
9.228
+0.09
0.98%
1 Jan 1978 Jahr
9.299
+0.071
0.77%
1 Jan 1979 Jahr
9.345
+0.046
0.49%
1 Jan 1980 Jahr
9.356
+0.012
0.12%
1 Jan 1981 Jahr
9.338
-0.018
-0.19%
1 Jan 1982 Jahr
9.363
+0.024
0.26%
1 Jan 1983 Jahr
9.369
+0.006
0.06%
1 Jan 1984 Jahr
9.372
+0.003
0.03%
1 Jan 1985 Jahr
9.392
+0.02
0.21%
1 Jan 1986 Jahr
9.441
+0.05
0.53%
1 Jan 1987 Jahr
9.551
+0.11
1.17%
1 Jan 1988 Jahr
9.668
+0.116
1.22%
1 Jan 1989 Jahr
9.788
+0.12
1.25%
1 Jan 1990 Jahr
9.905
+0.117
1.2%
1 Jan 1991 Jahr
10.019
+0.113
1.14%
1 Jan 1992 Jahr
10.161
+0.143
1.43%
1 Jan 1993 Jahr
10.309
+0.148
1.46%
1 Jan 1994 Jahr
10.462
+0.152
1.48%
1 Jan 1995 Jahr
10.611
+0.149
1.43%
1 Jan 1996 Jahr
10.758
+0.147
1.39%
1 Jan 1997 Jahr
10.913
+0.155
1.44%
1 Jan 1998 Jahr
11.05
+0.137
1.26%
1 Jan 1999 Jahr
11.193
+0.144
1.3%
1 Jan 2000 Jahr
11.381
+0.187
1.67%
1 Jan 2001 Jahr
11.632
+0.251
2.2%
1 Jan 2002 Jahr
12.072
+0.44
3.78%
1 Jan 2003 Jahr
12.61
+0.538
4.46%
1 Jan 2004 Jahr
13.204
+0.594
4.71%
1 Jan 2005 Jahr
13.766
+0.562
4.26%
1 Jan 2006 Jahr
14.256
+0.49
3.56%
1 Jan 2007 Jahr
14.427
+0.171
1.2%
1 Jan 2008 Jahr
14.6
+0.174
1.2%
1 Jan 2009 Jahr
14.875
+0.274
1.88%
1 Jan 2010 Jahr
15.352
+0.478
3.21%
1 Jan 2011 Jahr
16.057
+0.704
4.59%
1 Jan 2012 Jahr
16.638
+0.582
3.62%
1 Jan 2013 Jahr
17.303
+0.665
4.0%
1 Jan 2014 Jahr
18.007
+0.704
4.07%
1 Jan 2015 Jahr
18.671
+0.664
3.69%
1 Jan 2016 Jahr
19.248
+0.577
3.09%
Bewertung der Länder gemäß mit laufender Statistik nach Jahren


Kommentare: