29
/de/
de
AIzaSyAYiBZKx7MnpbEhh9jyipgxe19OcubqV5w
April 1, 2024
155114
India
IND
true
2
1
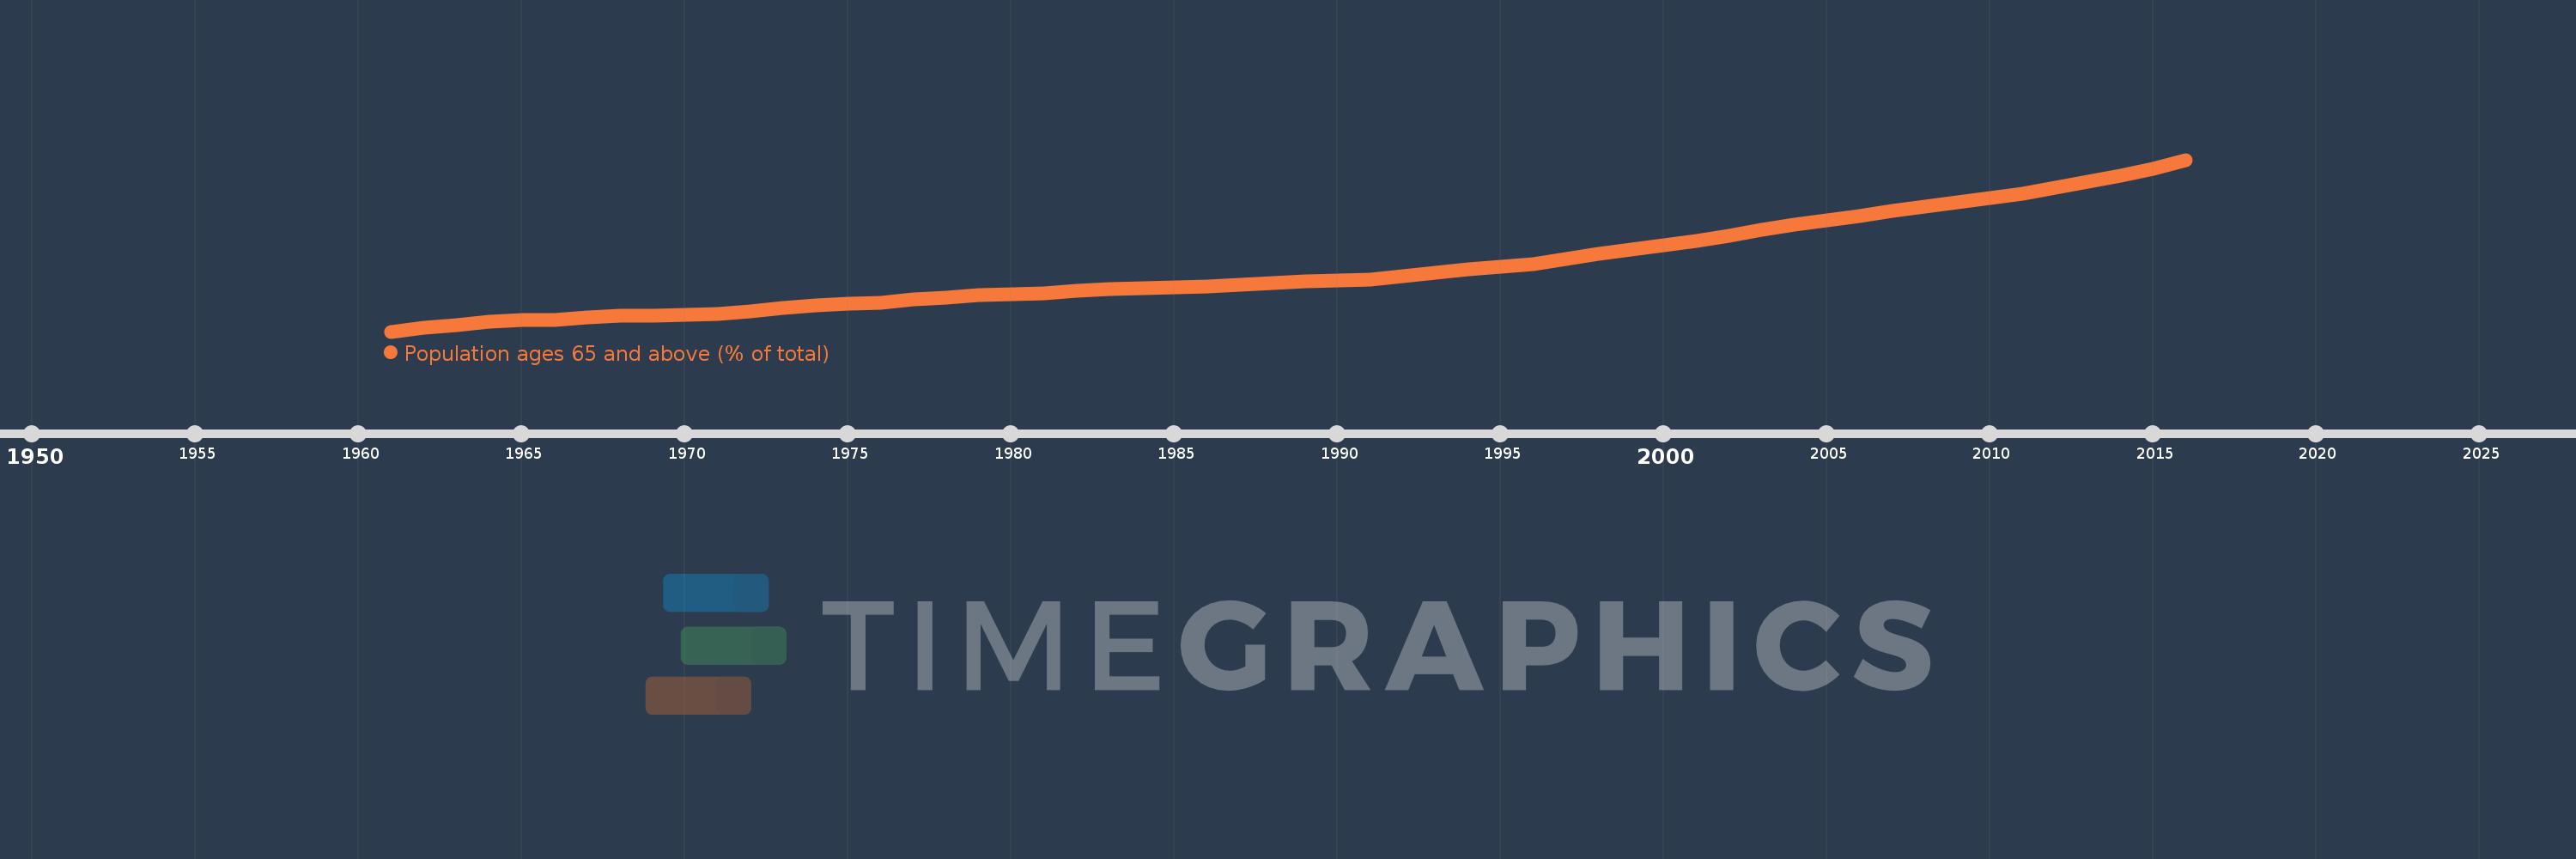
Population ages 65 and above (% of total)
2016,2015,2014,2013,2012,2011,2010,2009,2008,2007,2006,2005,2004,2003,2002,2001,2000,1999,1998,1997,1996,1995,1994,1993,1992,1991,1990,1989,1988,1987,1986,1985,1984,1983,1982,1981,1980,1979,1978,1977,1976,1975,1974,1973,1972,1971,1970,1969,1968,1967,1966,1965,1964,1963,1962,1961
Diese Statistik in anderen Ländern:
AfghanistanAlbaniaAlgeriaAngolaAntigua and BarbudaArab WorldArgentinaArmeniaArubaAustraliaAustriaAzerbaijanBahamas, TheBahrainBangladeshBarbadosBelarusBelgiumBelizeBeninBhutanBoliviaBosnia and HerzegovinaBotswanaBrazilBrunei DarussalamBulgariaBurkina FasoBurundiCabo VerdeCambodiaCameroonCanadaCaribbean small statesCentral African RepublicCentral Europe and the BalticsChadChannel IslandsChileChinaColombiaComorosCongo, Dem. Rep.Congo, Rep.Costa RicaCote d'IvoireCroatiaCubaCuracaoCyprusCzech RepublicDenmarkDjiboutiDominican RepublicEarly-demographic dividendEast Asia & PacificEast Asia & Pacific (excluding high income)East Asia & Pacific (IDA & IBRD countries)EcuadorEgypt, Arab Rep.El SalvadorEquatorial GuineaEritreaEstoniaEthiopiaEuro areaEurope & Central AsiaEurope & Central Asia (excluding high income)Europe & Central Asia (IDA & IBRD countries)European UnionFijiFinlandFragile and conflict affected situationsFranceFrench PolynesiaGabonGambia, TheGeorgiaGermanyGhanaGreeceGrenadaGuamGuatemalaGuineaGuinea-BissauGuyanaHaitiHeavily indebted poor countries (HIPC)High incomeHondurasHong Kong SAR, ChinaHungaryIBRD onlyIcelandIDA & IBRD totalIDA blendIDA onlyIDA totalIndiaIndonesiaIran, Islamic Rep.IraqIrelandIsraelItalyJamaicaJapanJordanKazakhstanKenyaKiribatiKorea, Dem. People’s Rep.Korea, Rep.KosovoKuwaitKyrgyz RepublicLao PDRLate-demographic dividendLatin America & Caribbean Latin America & Caribbean (excluding high income)Latin America & the Caribbean (IDA & IBRD countries)LatviaLeast developed countries: UN classificationLebanonLesothoLiberiaLibyaLithuaniaLow & middle incomeLow incomeLower middle incomeLuxembourgMacao SAR, ChinaMacedonia, FYRMadagascarMalawiMalaysiaMaldivesMaliMaltaMauritaniaMauritiusMexicoMicronesia, Fed. Sts.Middle East & North AfricaMiddle East & North Africa (excluding high income)Middle East & North Africa (IDA & IBRD countries)Middle incomeMoldovaMongoliaMontenegroMoroccoMozambiqueMyanmarNamibiaNepalNetherlandsNew CaledoniaNew ZealandNicaraguaNigerNigeriaNorth AmericaNorwayOECD membersOmanOther small statesPacific island small statesPakistanPanamaPapua New GuineaParaguayPeruPhilippinesPolandPortugalPost-demographic dividendPre-demographic dividendPuerto RicoQatarRomaniaRussian FederationRwandaSamoaSao Tome and PrincipeSaudi ArabiaSenegalSerbiaSeychellesSierra LeoneSingaporeSlovak RepublicSloveniaSmall statesSolomon IslandsSomaliaSouth AfricaSouth AsiaSouth Asia (IDA & IBRD)South SudanSpainSri LankaSt. LuciaSt. Vincent and the GrenadinesSub-Saharan Africa Sub-Saharan Africa (excluding high income)Sub-Saharan Africa (IDA & IBRD countries)SudanSurinameSwazilandSwedenSwitzerlandSyrian Arab RepublicTajikistanTanzaniaThailandTimor-LesteTogoTongaTrinidad and TobagoTunisiaTurkeyTurkmenistanUgandaUkraineUnited Arab EmiratesUnited KingdomUnited StatesUpper middle incomeUruguayUzbekistanVanuatuVenezuela, RBVietnamVirgin Islands (U.S.)West Bank and GazaWorldYemen, Rep.ZambiaZimbabwe Zeitlinie:
Diese Zeitleiste vorliegt die Graphik ab 1961 J. bis 2016 J. India. Die Angaben bis 1960 J. sind nicht vorhanden. Die Zahl aktueller Beobachtungen nach Daten: 56.
Die Quelle (Bezeichnung):
Kennzahlen der Weltentwicklung
Die Quelle (Einrichtung):
World Bank staff estimates based on age distributions of United Nations Population Division's World Population Prospects.
Kategorien:
Health
Es wurde aktualisiert:
23 Apr 2017 Jahr
Kennzahlen der Wertänderungen vom Jahr zum Jahr
Minimum:
3.061
1 Jan 1961 Jahr
Maximum:
5.616
1 Jan 2016 Jahr
Zum Datum der Beobachtung
Wert
Absolute Veränderung
Die Veränderung bezüglich dem vorherigen Wert
1 Jan 1961 Jahr
3.061
+3.061
0.0%
1 Jan 1962 Jahr
3.113
+0.052
1.72%
1 Jan 1963 Jahr
3.163
+0.05
1.61%
1 Jan 1964 Jahr
3.204
+0.041
1.29%
1 Jan 1965 Jahr
3.228
+0.024
0.75%
1 Jan 1966 Jahr
3.233
+0.005
0.16%
1 Jan 1967 Jahr
3.27
+0.037
1.15%
1 Jan 1968 Jahr
3.291
+0.021
0.65%
1 Jan 1969 Jahr
3.303
+0.011
0.35%
1 Jan 1970 Jahr
3.311
+0.008
0.24%
1 Jan 1971 Jahr
3.318
+0.007
0.22%
1 Jan 1972 Jahr
3.367
+0.049
1.47%
1 Jan 1973 Jahr
3.411
+0.045
1.33%
1 Jan 1974 Jahr
3.449
+0.038
1.1%
1 Jan 1975 Jahr
3.477
+0.028
0.81%
1 Jan 1976 Jahr
3.495
+0.018
0.51%
1 Jan 1977 Jahr
3.539
+0.044
1.26%
1 Jan 1978 Jahr
3.572
+0.034
0.96%
1 Jan 1979 Jahr
3.598
+0.026
0.72%
1 Jan 1980 Jahr
3.617
+0.019
0.53%
1 Jan 1981 Jahr
3.631
+0.014
0.38%
1 Jan 1982 Jahr
3.667
+0.036
1.0%
1 Jan 1983 Jahr
3.694
+0.027
0.73%
1 Jan 1984 Jahr
3.712
+0.018
0.5%
1 Jan 1985 Jahr
3.724
+0.012
0.32%
1 Jan 1986 Jahr
3.732
+0.008
0.21%
1 Jan 1987 Jahr
3.763
+0.031
0.83%
1 Jan 1988 Jahr
3.788
+0.025
0.66%
1 Jan 1989 Jahr
3.807
+0.019
0.51%
1 Jan 1990 Jahr
3.822
+0.015
0.39%
1 Jan 1991 Jahr
3.833
+0.011
0.3%
1 Jan 1992 Jahr
3.89
+0.057
1.48%
1 Jan 1993 Jahr
3.94
+0.051
1.3%
1 Jan 1994 Jahr
3.986
+0.045
1.15%
1 Jan 1995 Jahr
4.028
+0.042
1.05%
1 Jan 1996 Jahr
4.068
+0.04
0.99%
1 Jan 1997 Jahr
4.144
+0.076
1.87%
1 Jan 1998 Jahr
4.214
+0.07
1.7%
1 Jan 1999 Jahr
4.28
+0.066
1.57%
1 Jan 2000 Jahr
4.344
+0.064
1.49%
1 Jan 2001 Jahr
4.407
+0.063
1.45%
1 Jan 2002 Jahr
4.491
+0.084
1.92%
1 Jan 2003 Jahr
4.572
+0.081
1.81%
1 Jan 2004 Jahr
4.649
+0.076
1.67%
1 Jan 2005 Jahr
4.717
+0.069
1.48%
1 Jan 2006 Jahr
4.778
+0.061
1.29%
1 Jan 2007 Jahr
4.855
+0.077
1.61%
1 Jan 2008 Jahr
4.924
+0.07
1.43%
1 Jan 2009 Jahr
4.989
+0.065
1.31%
1 Jan 2010 Jahr
5.051
+0.062
1.24%
1 Jan 2011 Jahr
5.113
+0.062
1.23%
1 Jan 2012 Jahr
5.203
+0.09
1.76%
1 Jan 2013 Jahr
5.29
+0.087
1.67%
1 Jan 2014 Jahr
5.381
+0.092
1.73%
1 Jan 2015 Jahr
5.488
+0.107
1.99%
1 Jan 2016 Jahr
5.616
+0.128
2.33%
Bewertung der Länder gemäß mit laufender Statistik nach Jahren


Kommentare: