29
/de/
de
AIzaSyAYiBZKx7MnpbEhh9jyipgxe19OcubqV5w
April 1, 2024
189244
Maldives
MDV
true
2
1
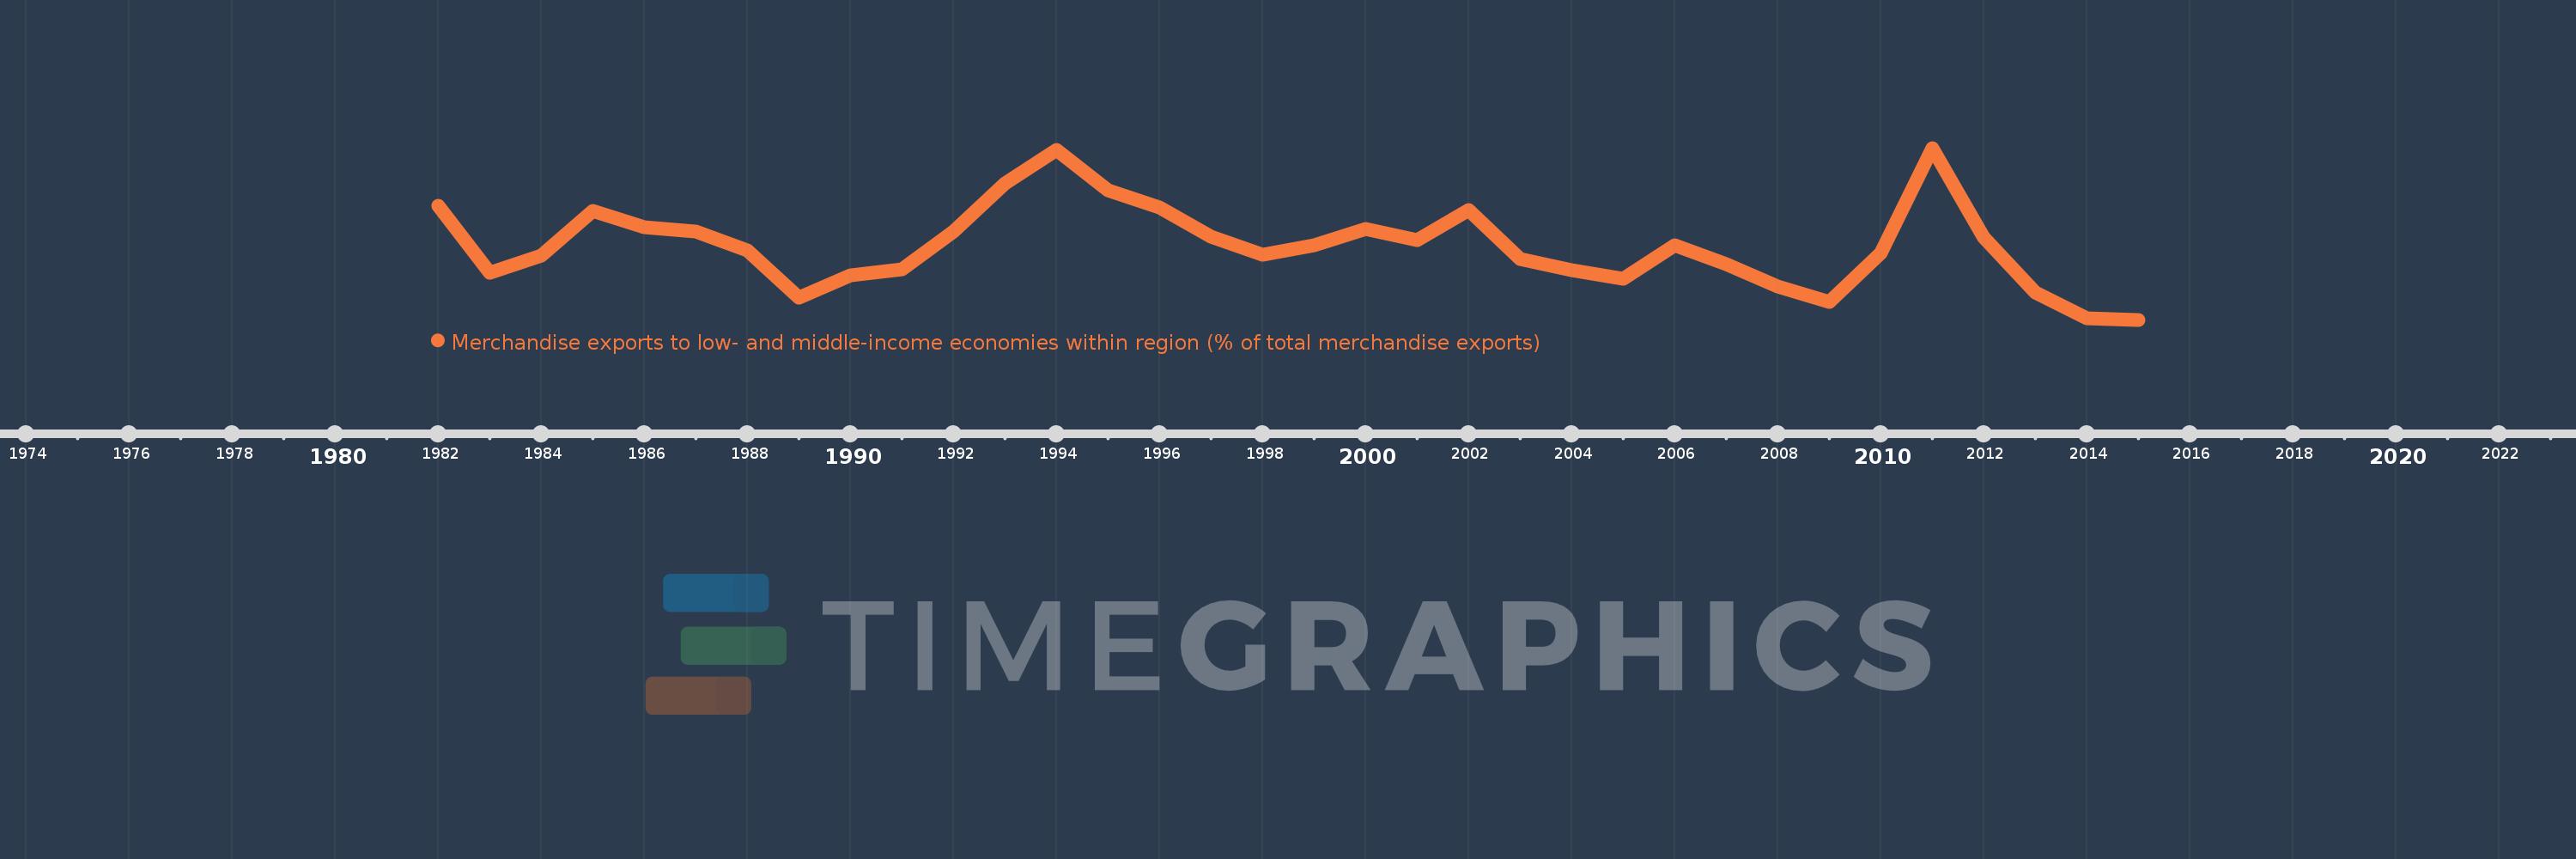
Merchandise exports to low- and middle-income economies within region (% of total merchandise exports)
2015,2014,2013,2012,2011,2010,2009,2008,2007,2006,2005,2004,2003,2002,2001,2000,1999,1998,1997,1996,1995,1994,1993,1992,1991,1990,1989,1988,1987,1986,1985,1984,1983,1982
Diese Statistik in anderen Ländern:
Zeitlinie:
Diese Zeitleiste vorliegt die Graphik ab 1982 J. bis 2015 J. Maldives. Die Angaben bis 1981 J. sind nicht vorhanden. Die Zahl aktueller Beobachtungen nach Daten: 34.
Die Quelle (Bezeichnung):
Kennzahlen der Weltentwicklung
Die Quelle (Einrichtung):
World Bank staff estimates based data from International Monetary Fund's Direction of Trade database.
Kategorien:
Private Sector, Trade
Es wurde aktualisiert:
23 Apr 2017 Jahr
Kennzahlen der Wertänderungen vom Jahr zum Jahr
Minimum:
7.071
1 Jan 2015 Jahr
Maximum:
30.813
1 Jan 2011 Jahr
Zum Datum der Beobachtung
Wert
Absolute Veränderung
Die Veränderung bezüglich dem vorherigen Wert
1 Jan 1982 Jahr
22.827
+22.827
0.0%
1 Jan 1983 Jahr
13.576
-9.252
-40.53%
1 Jan 1984 Jahr
15.881
+2.306
16.99%
1 Jan 1985 Jahr
22.077
+6.195
39.01%
1 Jan 1986 Jahr
19.89
-2.187
-9.91%
1 Jan 1987 Jahr
19.249
-0.64
-3.22%
1 Jan 1988 Jahr
16.595
-2.654
-13.79%
1 Jan 1989 Jahr
10.07
-6.525
-39.32%
1 Jan 1990 Jahr
13.237
+3.166
31.44%
1 Jan 1991 Jahr
13.987
+0.75
5.67%
1 Jan 1992 Jahr
19.229
+5.242
37.48%
1 Jan 1993 Jahr
25.895
+6.667
34.67%
1 Jan 1994 Jahr
30.574
+4.678
18.07%
1 Jan 1995 Jahr
24.905
-5.668
-18.54%
1 Jan 1996 Jahr
22.624
-2.281
-9.16%
1 Jan 1997 Jahr
18.528
-4.096
-18.1%
1 Jan 1998 Jahr
16.085
-2.443
-13.18%
1 Jan 1999 Jahr
17.348
+1.263
7.85%
1 Jan 2000 Jahr
19.567
+2.218
12.79%
1 Jan 2001 Jahr
18.134
-1.433
-7.32%
1 Jan 2002 Jahr
22.196
+4.062
22.4%
1 Jan 2003 Jahr
15.494
-6.702
-30.19%
1 Jan 2004 Jahr
13.923
-1.572
-10.14%
1 Jan 2005 Jahr
12.688
-1.235
-8.87%
1 Jan 2006 Jahr
17.382
+4.694
36.99%
1 Jan 2007 Jahr
14.723
-2.658
-15.29%
1 Jan 2008 Jahr
11.621
-3.102
-21.07%
1 Jan 2009 Jahr
9.54
-2.081
-17.91%
1 Jan 2010 Jahr
16.345
+6.805
71.33%
1 Jan 2011 Jahr
30.813
+14.468
88.51%
1 Jan 2012 Jahr
18.468
-12.345
-40.06%
1 Jan 2013 Jahr
10.862
-7.606
-41.18%
1 Jan 2014 Jahr
7.294
-3.568
-32.85%
1 Jan 2015 Jahr
7.071
-0.223
-3.06%
Bewertung der Länder gemäß mit laufender Statistik nach Jahren


Kommentare: