29
/de/
de
AIzaSyAYiBZKx7MnpbEhh9jyipgxe19OcubqV5w
April 1, 2024
157568
Iran, Islamic Rep.
IRN
true
2
1
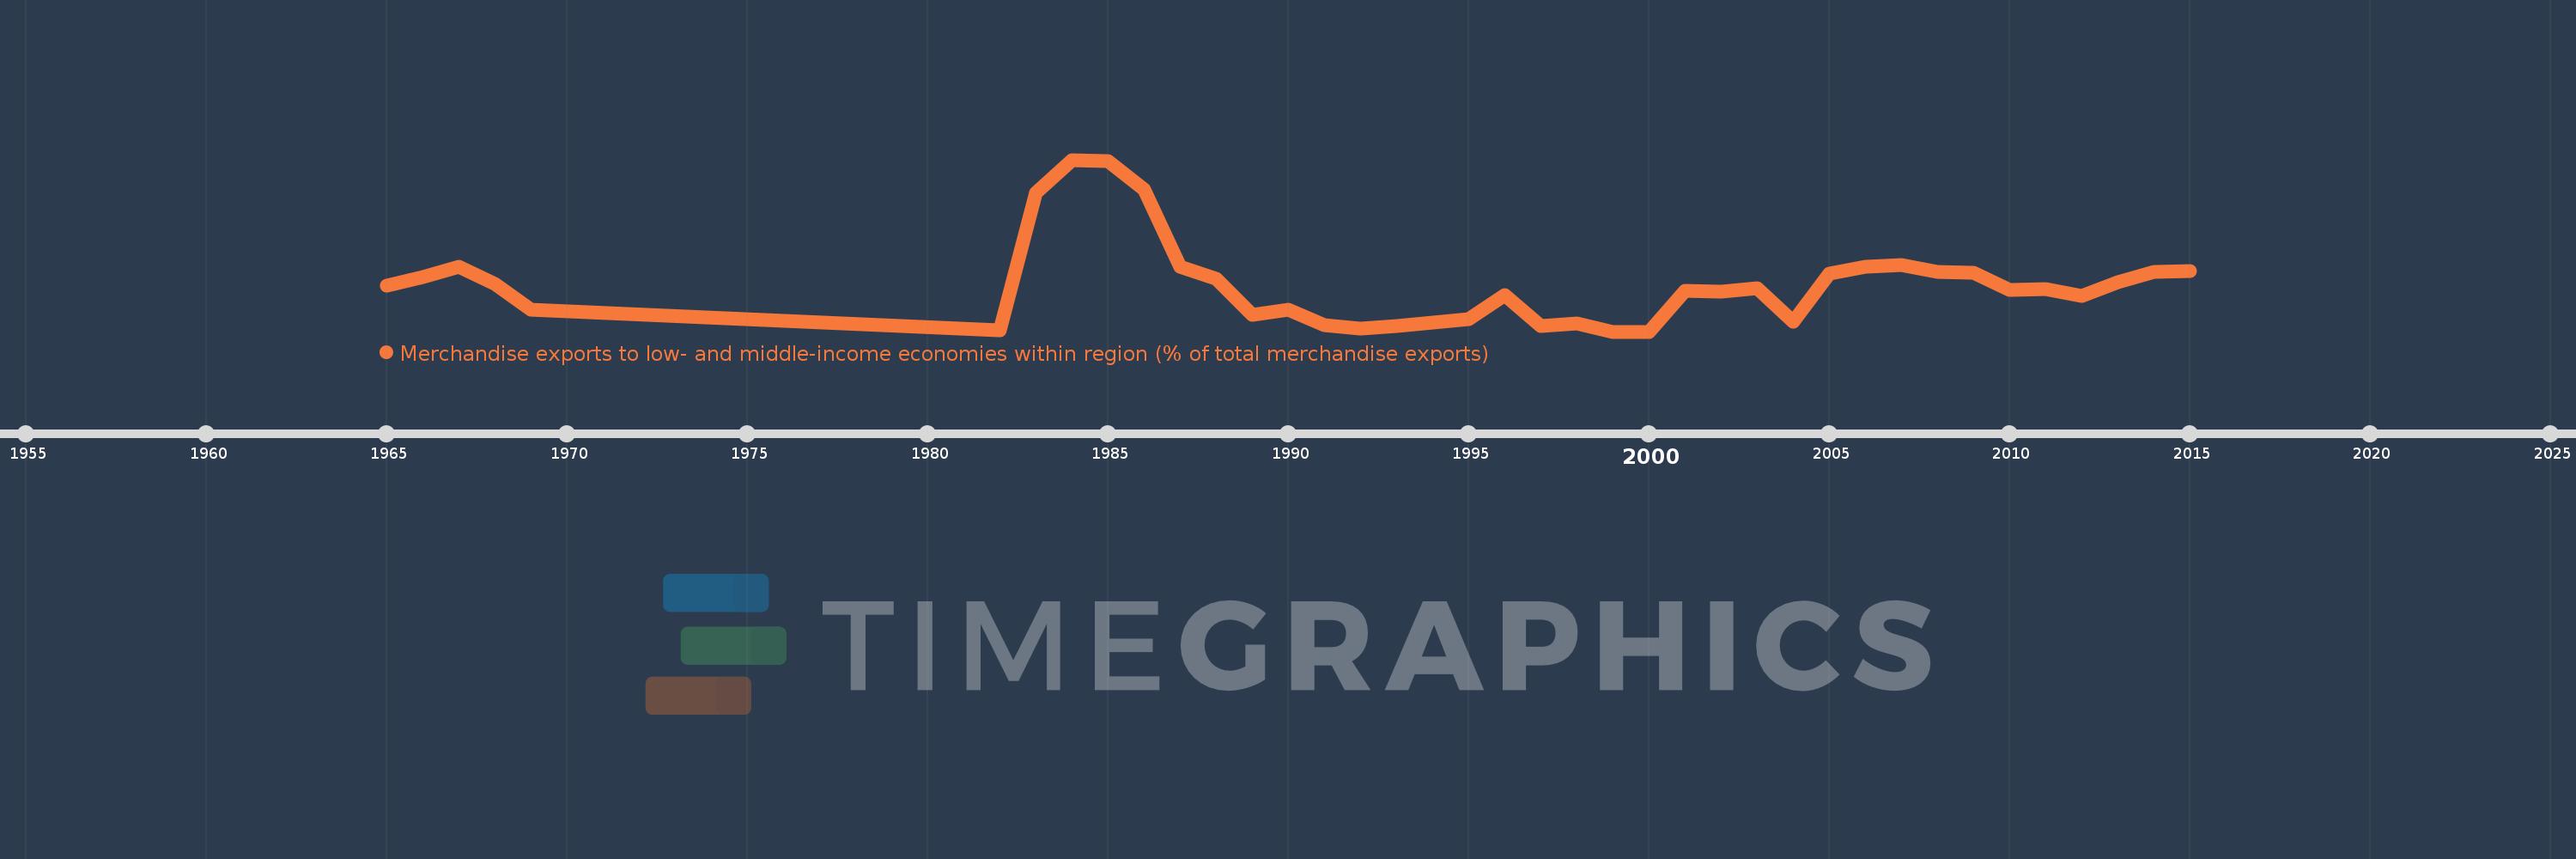
Merchandise exports to low- and middle-income economies within region (% of total merchandise exports)
2015,2014,2013,2012,2011,2010,2009,2008,2007,2006,2005,2004,2003,2002,2001,2000,1999,1998,1997,1996,1995,1994,1993,1992,1991,1990,1989,1988,1987,1986,1985,1984,1983,1982,1969,1968,1967,1966,1965
Diese Statistik in anderen Ländern:
Zeitlinie:
Diese Zeitleiste vorliegt die Graphik ab 1965 J. bis 2015 J. Iran, Islamic Rep.. Die Angaben bis 1964 J. sind nicht vorhanden. Die Zahl aktueller Beobachtungen nach Daten: 39.
Die Quelle (Bezeichnung):
Kennzahlen der Weltentwicklung
Die Quelle (Einrichtung):
World Bank staff estimates based data from International Monetary Fund's Direction of Trade database.
Kategorien:
Private Sector, Trade
Es wurde aktualisiert:
23 Apr 2017 Jahr
Kennzahlen der Wertänderungen vom Jahr zum Jahr
Minimum:
0.0
1 Jan 1999 Jahr
Maximum:
5.661
1 Jan 1984 Jahr
Zum Datum der Beobachtung
Wert
Absolute Veränderung
Die Veränderung bezüglich dem vorherigen Wert
1 Jan 1965 Jahr
1.503
+1.503
0.0%
1 Jan 1966 Jahr
1.795
+0.292
19.41%
1 Jan 1967 Jahr
2.14
+0.345
19.22%
1 Jan 1968 Jahr
1.573
-0.567
-26.5%
1 Jan 1969 Jahr
0.733
-0.84
-53.42%
1 Jan 1982 Jahr
0.037
-0.696
-94.99%
1 Jan 1983 Jahr
4.584
+4.547
12.39 Tsnd.%
1 Jan 1984 Jahr
5.661
+1.077
23.49%
1 Jan 1985 Jahr
5.63
-0.031
-0.54%
1 Jan 1986 Jahr
4.695
-0.935
-16.61%
1 Jan 1987 Jahr
2.124
-2.571
-54.76%
1 Jan 1988 Jahr
1.751
-0.373
-17.54%
1 Jan 1989 Jahr
0.538
-1.213
-69.29%
1 Jan 1990 Jahr
0.719
+0.181
33.6%
1 Jan 1991 Jahr
0.217
-0.502
-69.87%
1 Jan 1992 Jahr
0.107
-0.11
-50.75%
1 Jan 1993 Jahr
0.189
+0.083
77.47%
1 Jan 1994 Jahr
0.304
+0.115
60.74%
1 Jan 1995 Jahr
0.403
+0.099
32.44%
1 Jan 1996 Jahr
1.197
+0.794
197.14%
1 Jan 1997 Jahr
0.185
-1.012
-84.56%
1 Jan 1998 Jahr
0.27
+0.085
46.24%
1 Jan 1999 Jahr
0.0
-0.27
-100.0%
1 Jan 2001 Jahr
1.353
+1.353
%
1 Jan 2002 Jahr
1.309
-0.044
-3.22%
1 Jan 2003 Jahr
1.442
+0.133
10.13%
1 Jan 2004 Jahr
0.337
-1.104
-76.59%
1 Jan 2005 Jahr
1.915
+1.577
467.41%
1 Jan 2006 Jahr
2.142
+0.228
11.88%
1 Jan 2007 Jahr
2.202
+0.059
2.77%
1 Jan 2008 Jahr
1.972
-0.229
-10.42%
1 Jan 2009 Jahr
1.94
-0.033
-1.66%
1 Jan 2010 Jahr
1.371
-0.569
-29.31%
1 Jan 2011 Jahr
1.395
+0.024
1.76%
1 Jan 2012 Jahr
1.181
-0.215
-15.38%
1 Jan 2013 Jahr
1.619
+0.438
37.11%
1 Jan 2014 Jahr
1.958
+0.339
20.94%
1 Jan 2015 Jahr
1.998
+0.04
2.02%
Bewertung der Länder gemäß mit laufender Statistik nach Jahren


Kommentare: