29
/de/
de
AIzaSyAYiBZKx7MnpbEhh9jyipgxe19OcubqV5w
April 1, 2024
145043
Guatemala
GTM
true
2
1
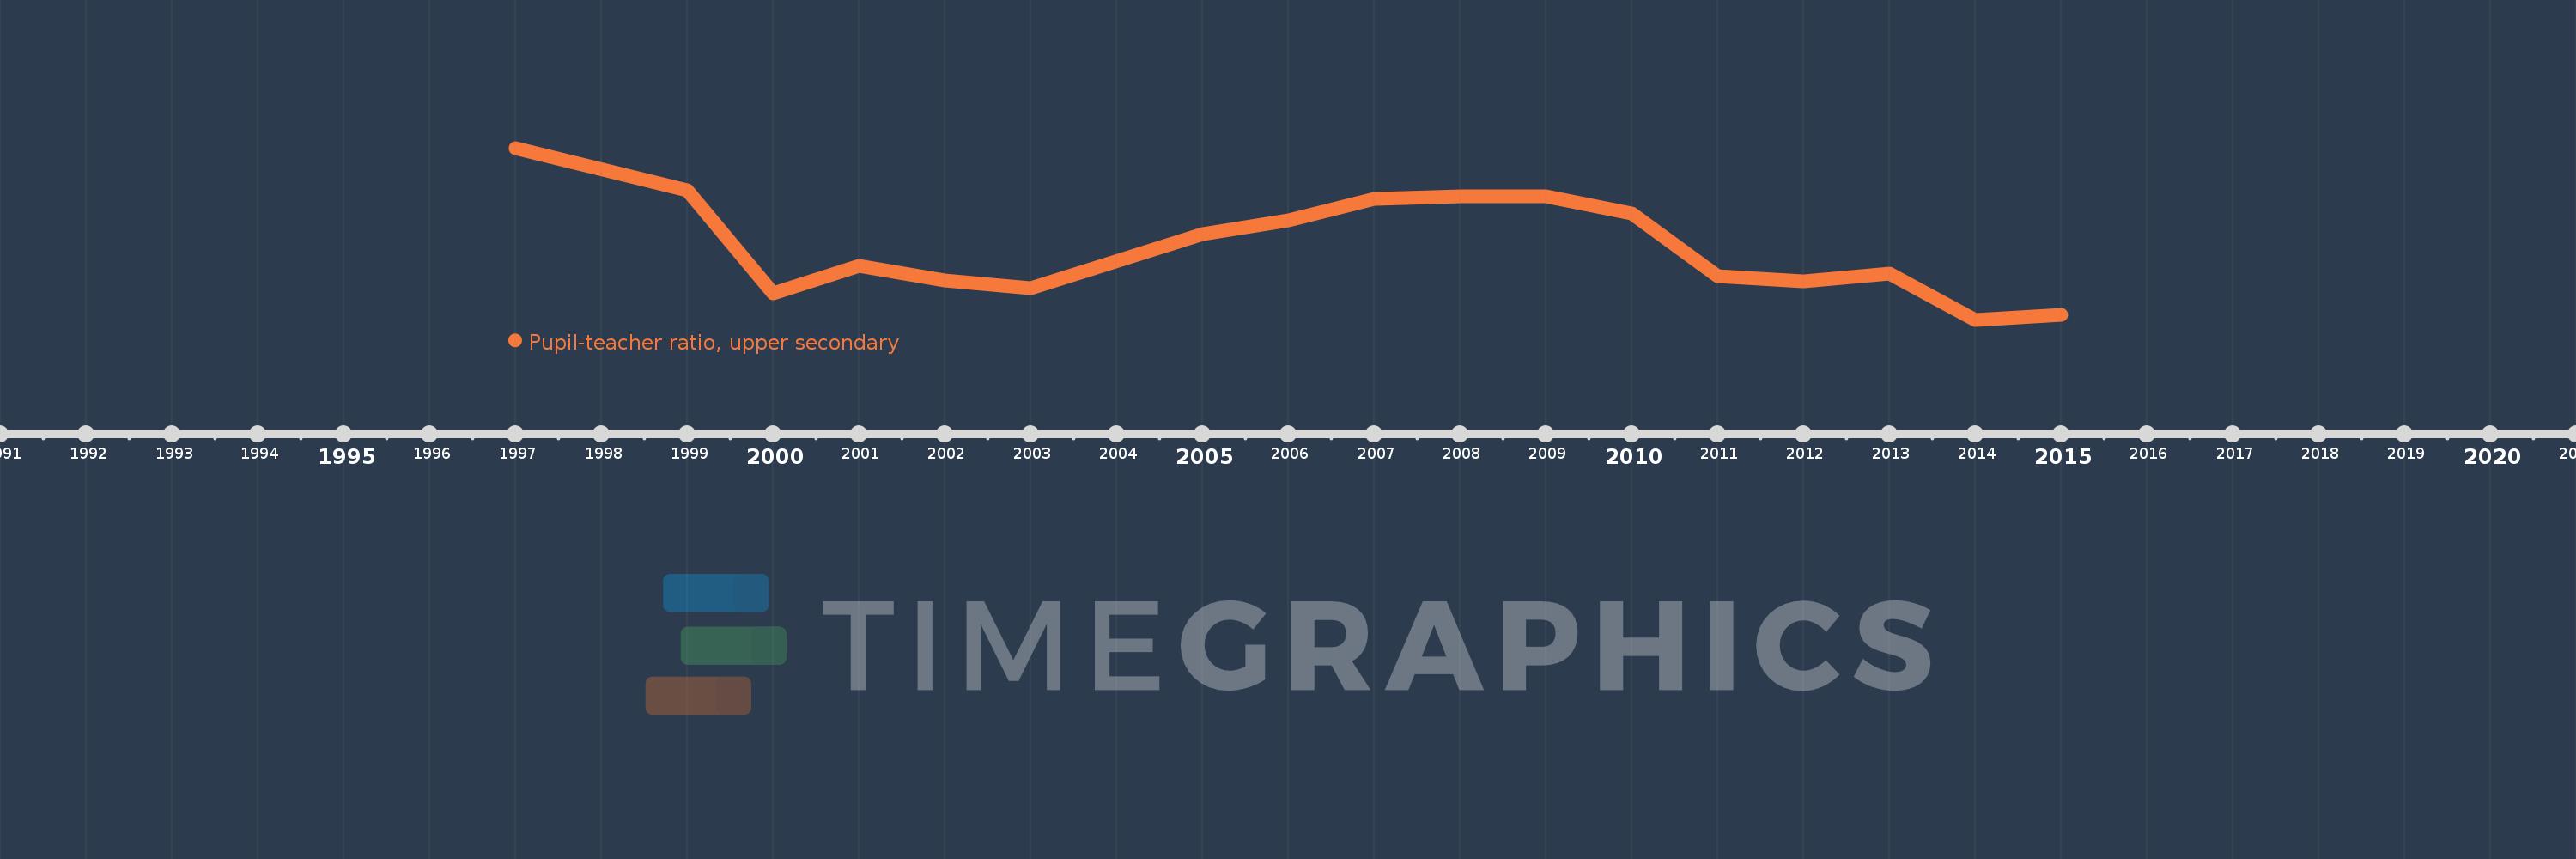
Pupil-teacher ratio, upper secondary
2015,2014,2013,2012,2011,2010,2009,2008,2007,2006,2005,2003,2002,2001,2000,1999,1997
Diese Statistik in anderen Ländern:
Zeitlinie:
Diese Zeitleiste vorliegt die Graphik ab 1997 J. bis 2015 J. Guatemala. Die Angaben bis 1996 J. sind nicht vorhanden. Die Zahl aktueller Beobachtungen nach Daten: 17.
Die Quelle (Bezeichnung):
Kennzahlen der Weltentwicklung
Die Quelle (Einrichtung):
United Nations Educational, Scientific, and Cultural Organization (UNESCO) Institute for Statistics.
Kategorien:
Education
Es wurde aktualisiert:
23 Apr 2017 Jahr
Kennzahlen der Wertänderungen vom Jahr zum Jahr
Minimum:
10.251
1 Jan 2014 Jahr
Maximum:
16.15
1 Jan 1997 Jahr
Zum Datum der Beobachtung
Wert
Absolute Veränderung
Die Veränderung bezüglich dem vorherigen Wert
1 Jan 1997 Jahr
16.15
+16.15
0.0%
1 Jan 1999 Jahr
14.7
-1.45
-8.98%
1 Jan 2000 Jahr
11.163
-3.537
-24.06%
1 Jan 2001 Jahr
12.1
+0.937
8.4%
1 Jan 2002 Jahr
11.599
-0.501
-4.14%
1 Jan 2003 Jahr
11.343
-0.256
-2.2%
1 Jan 2005 Jahr
13.18
+1.836
16.19%
1 Jan 2006 Jahr
13.657
+0.477
3.62%
1 Jan 2007 Jahr
14.409
+0.752
5.51%
1 Jan 2008 Jahr
14.477
+0.067
0.47%
1 Jan 2009 Jahr
14.476
0.0
0.0%
1 Jan 2010 Jahr
13.893
-0.583
-4.03%
1 Jan 2011 Jahr
11.738
-2.155
-15.51%
1 Jan 2012 Jahr
11.578
-0.16
-1.37%
1 Jan 2013 Jahr
11.826
+0.249
2.15%
1 Jan 2014 Jahr
10.251
-1.575
-13.32%
1 Jan 2015 Jahr
10.416
+0.165
1.61%
Bewertung der Länder gemäß mit laufender Statistik nach Jahren


Kommentare: