29
/de/
de
AIzaSyAYiBZKx7MnpbEhh9jyipgxe19OcubqV5w
April 1, 2024
133571
Finland
FIN
true
2
1
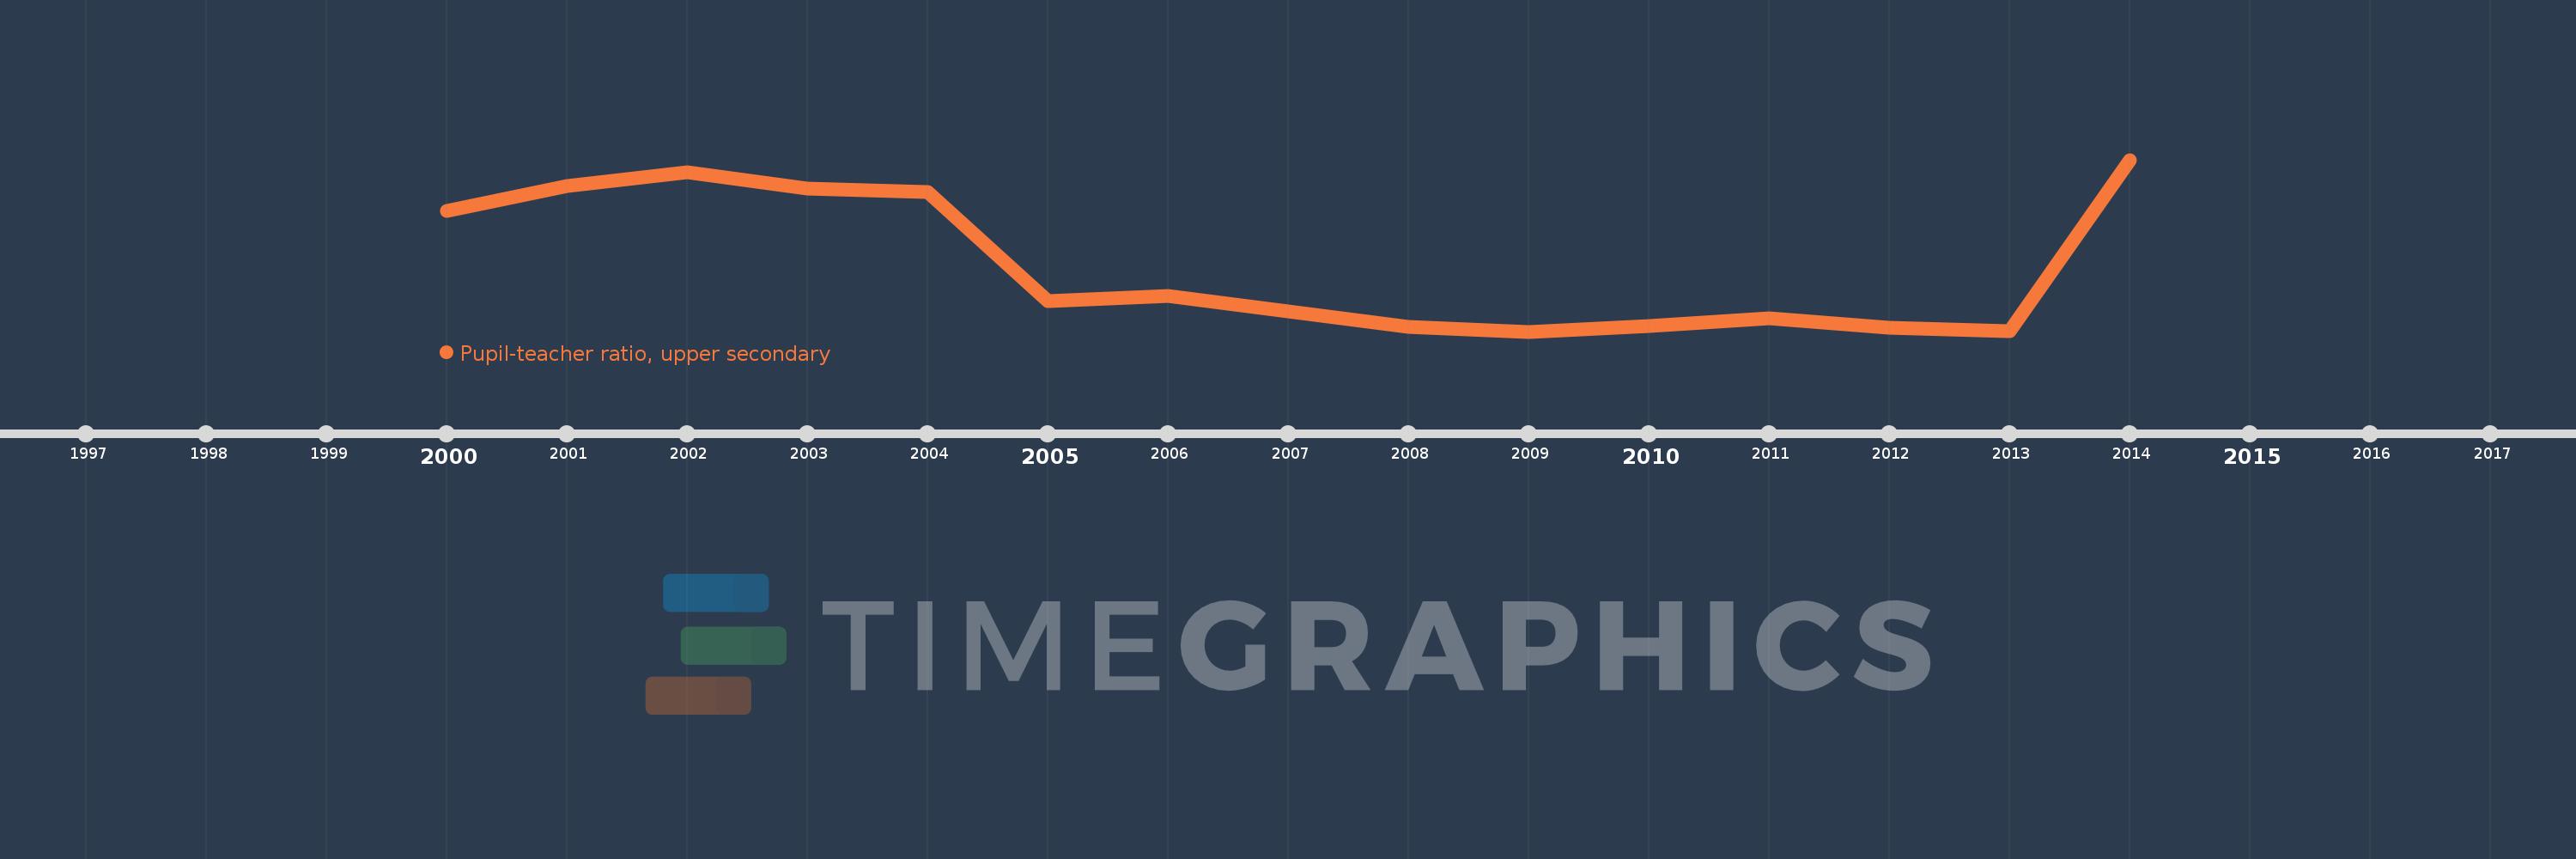
Pupil-teacher ratio, upper secondary
2014,2013,2012,2011,2010,2009,2008,2006,2005,2004,2003,2002,2001,2000
Diese Statistik in anderen Ländern:
Zeitlinie:
Diese Zeitleiste vorliegt die Graphik ab 2000 J. bis 2014 J. Finland. Die Angaben bis 1999 J. sind nicht vorhanden. Die Zahl aktueller Beobachtungen nach Daten: 14.
Die Quelle (Bezeichnung):
Kennzahlen der Weltentwicklung
Die Quelle (Einrichtung):
United Nations Educational, Scientific, and Cultural Organization (UNESCO) Institute for Statistics.
Kategorien:
Education
Es wurde aktualisiert:
23 Apr 2017 Jahr
Kennzahlen der Wertänderungen vom Jahr zum Jahr
Minimum:
9.639
1 Jan 2009 Jahr
Maximum:
15.994
1 Jan 2014 Jahr
Zum Datum der Beobachtung
Wert
Absolute Veränderung
Die Veränderung bezüglich dem vorherigen Wert
1 Jan 2000 Jahr
14.106
+14.106
0.0%
1 Jan 2001 Jahr
15.03
+0.923
6.55%
1 Jan 2002 Jahr
15.547
+0.517
3.44%
1 Jan 2003 Jahr
14.916
-0.631
-4.06%
1 Jan 2004 Jahr
14.787
-0.129
-0.86%
1 Jan 2005 Jahr
10.754
-4.033
-27.27%
1 Jan 2006 Jahr
10.964
+0.21
1.95%
1 Jan 2008 Jahr
9.826
-1.138
-10.38%
1 Jan 2009 Jahr
9.639
-0.187
-1.9%
1 Jan 2010 Jahr
9.84
+0.201
2.09%
1 Jan 2011 Jahr
10.131
+0.291
2.95%
1 Jan 2012 Jahr
9.769
-0.362
-3.58%
1 Jan 2013 Jahr
9.659
-0.11
-1.12%
1 Jan 2014 Jahr
15.994
+6.335
65.59%
Bewertung der Länder gemäß mit laufender Statistik nach Jahren


Kommentare: