29
/de/
de
AIzaSyAYiBZKx7MnpbEhh9jyipgxe19OcubqV5w
April 1, 2024
133646
Finland
FIN
true
2
1
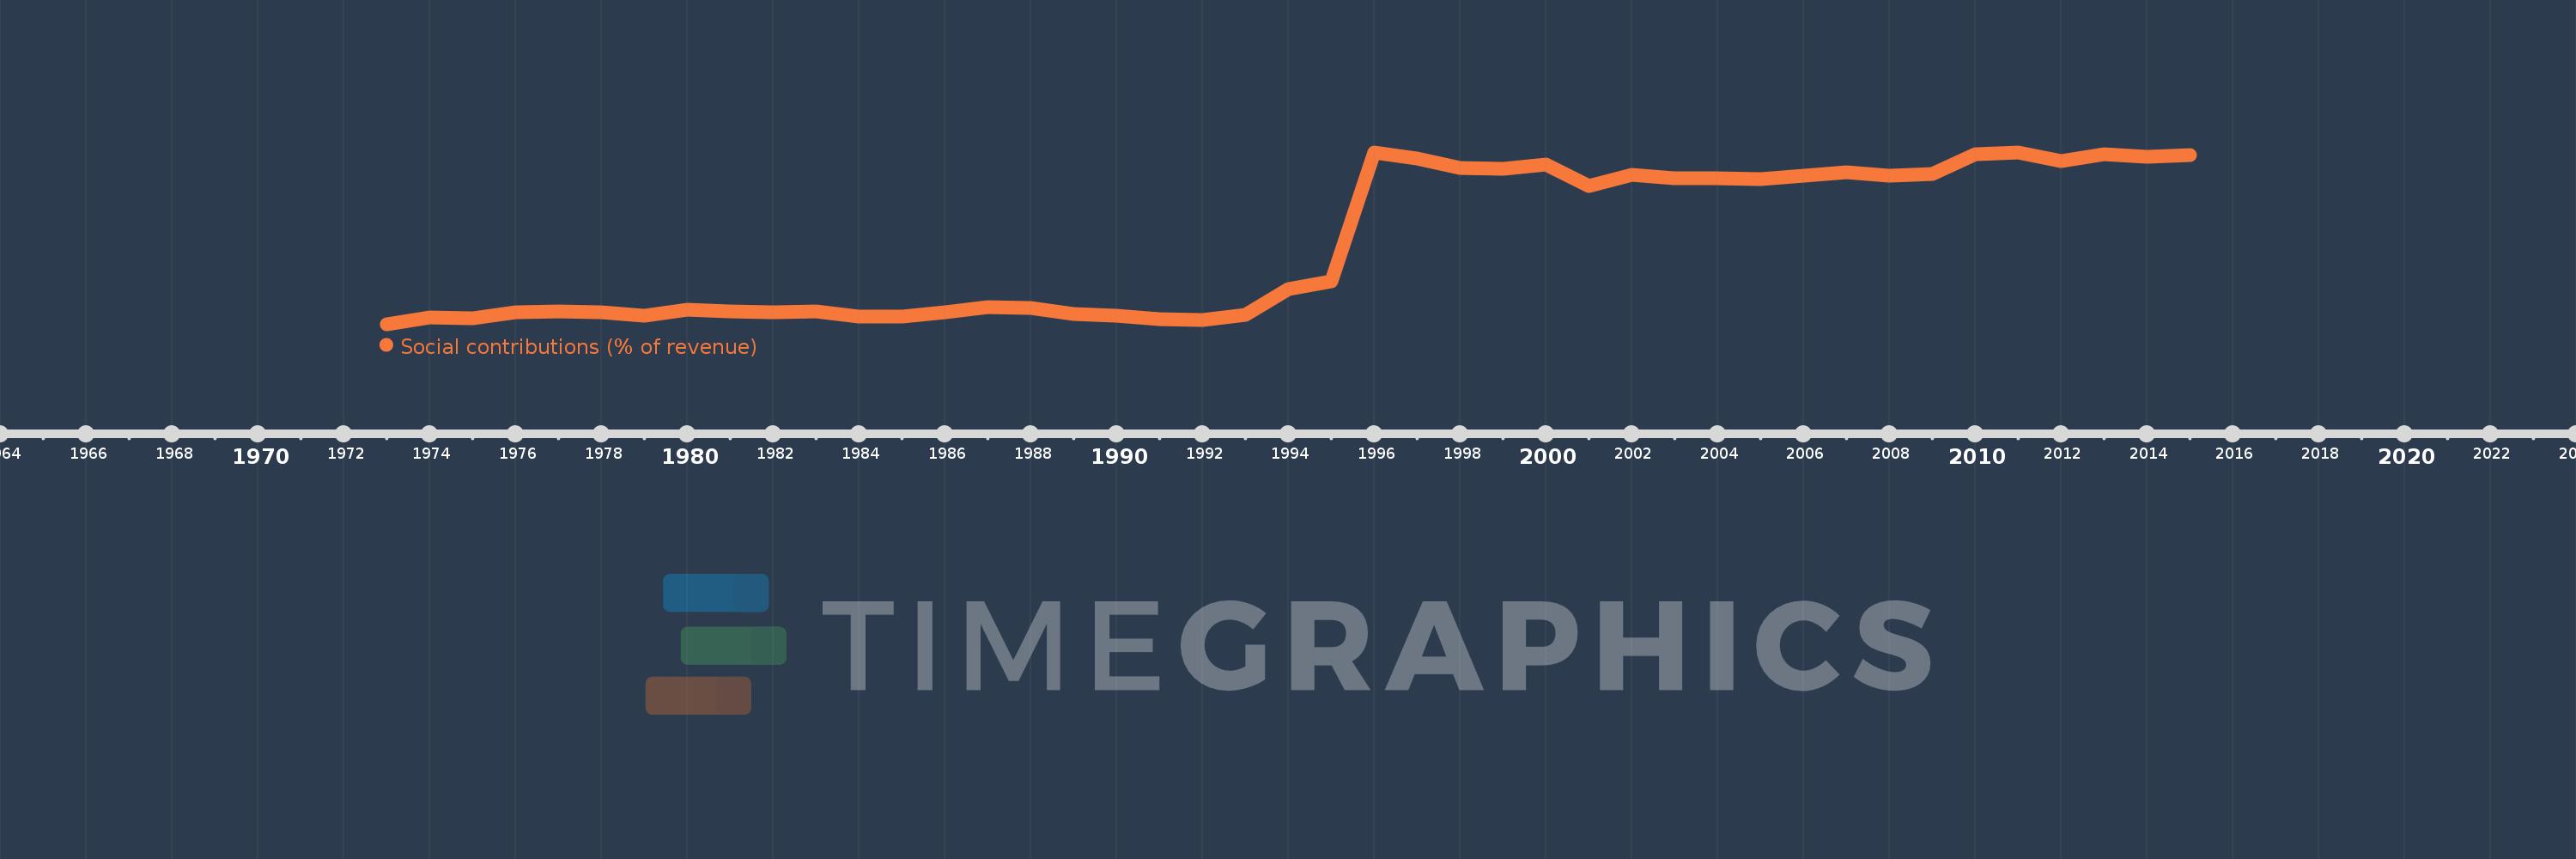
Social contributions (% of revenue)
2015,2014,2013,2012,2011,2010,2009,2008,2007,2006,2005,2004,2003,2002,2001,2000,1999,1998,1997,1996,1995,1994,1993,1992,1991,1990,1989,1988,1987,1986,1985,1984,1983,1982,1981,1980,1979,1978,1977,1976,1975,1974,1973
Diese Statistik in anderen Ländern:
Zeitlinie:
Diese Zeitleiste vorliegt die Graphik ab 1973 J. bis 2015 J. Finland. Die Angaben bis 1972 J. sind nicht vorhanden. Die Zahl aktueller Beobachtungen nach Daten: 43.
Die Quelle (Bezeichnung):
Kennzahlen der Weltentwicklung
Die Quelle (Einrichtung):
International Monetary Fund, Government Finance Statistics Yearbook and data files.
Kategorien:
Public Sector
Es wurde aktualisiert:
23 Apr 2017 Jahr
Kennzahlen der Wertänderungen vom Jahr zum Jahr
Minimum:
7.685
1 Jan 1973 Jahr
Maximum:
33.088
1 Jan 1996 Jahr
Zum Datum der Beobachtung
Wert
Absolute Veränderung
Die Veränderung bezüglich dem vorherigen Wert
1 Jan 1973 Jahr
7.685
+7.685
0.0%
1 Jan 1974 Jahr
8.724
+1.038
13.51%
1 Jan 1975 Jahr
8.541
-0.183
-2.1%
1 Jan 1976 Jahr
9.447
+0.906
10.61%
1 Jan 1977 Jahr
9.617
+0.17
1.8%
1 Jan 1978 Jahr
9.394
-0.223
-2.31%
1 Jan 1979 Jahr
8.909
-0.485
-5.17%
1 Jan 1980 Jahr
9.834
+0.926
10.39%
1 Jan 1981 Jahr
9.566
-0.268
-2.73%
1 Jan 1982 Jahr
9.485
-0.081
-0.85%
1 Jan 1983 Jahr
9.633
+0.148
1.56%
1 Jan 1984 Jahr
8.854
-0.78
-8.09%
1 Jan 1985 Jahr
8.834
-0.02
-0.22%
1 Jan 1986 Jahr
9.388
+0.554
6.27%
1 Jan 1987 Jahr
10.177
+0.788
8.4%
1 Jan 1988 Jahr
10.068
-0.109
-1.07%
1 Jan 1989 Jahr
9.251
-0.816
-8.11%
1 Jan 1990 Jahr
8.924
-0.327
-3.54%
1 Jan 1991 Jahr
8.417
-0.508
-5.69%
1 Jan 1992 Jahr
8.273
-0.144
-1.71%
1 Jan 1993 Jahr
9.057
+0.784
9.48%
1 Jan 1994 Jahr
12.876
+3.819
42.17%
1 Jan 1995 Jahr
14.063
+1.187
9.22%
1 Jan 1996 Jahr
33.088
+19.025
135.28%
1 Jan 1997 Jahr
32.181
-0.906
-2.74%
1 Jan 1998 Jahr
30.849
-1.332
-4.14%
1 Jan 1999 Jahr
30.647
-0.202
-0.65%
1 Jan 2000 Jahr
31.358
+0.711
2.32%
1 Jan 2001 Jahr
28.171
-3.187
-10.16%
1 Jan 2002 Jahr
29.822
+1.65
5.86%
1 Jan 2003 Jahr
29.225
-0.596
-2.0%
1 Jan 2004 Jahr
29.287
+0.061
0.21%
1 Jan 2005 Jahr
29.154
-0.133
-0.45%
1 Jan 2006 Jahr
29.686
+0.532
1.82%
1 Jan 2007 Jahr
30.133
+0.447
1.5%
1 Jan 2008 Jahr
29.676
-0.457
-1.52%
1 Jan 2009 Jahr
29.875
+0.199
0.67%
1 Jan 2010 Jahr
32.775
+2.901
9.71%
1 Jan 2011 Jahr
33.016
+0.241
0.73%
1 Jan 2012 Jahr
31.777
-1.239
-3.75%
1 Jan 2013 Jahr
32.777
+1.001
3.15%
1 Jan 2014 Jahr
32.464
-0.314
-0.96%
1 Jan 2015 Jahr
32.738
+0.274
0.84%
Bewertung der Länder gemäß mit laufender Statistik nach Jahren


Kommentare: