30
/de/
AIzaSyAYiBZKx7MnpbEhh9jyipgxe19OcubqV5w
April 1, 2024
129893
Estonia
EST
true
2
1
Social contributions (% of revenue)
2014,2013,2012,2011,2010,2009,2008,2007,2006,2005,2004,2003,2002,2001,2000,1999,1998,1997,1996,1995,1994,1993,1992
Download
Bibliothek der Globalstatistik →Estonia →

Social contributions (% of revenue)

Diese Statistik in anderen Ländern:

AfghanistanAlbaniaAngolaArgentinaArmeniaAustraliaAustriaAzerbaijanBarbadosBelarusBelgiumBelizeBeninBhutanBoliviaBosnia and HerzegovinaBrazilBulgariaBurundiCabo VerdeCanadaCaribbean small statesCentral African RepublicCentral Europe and the BalticsChileChinaColombiaCongo, Rep.Costa RicaCote d'IvoireCroatiaCyprusCzech RepublicDenmarkDominican RepublicEgypt, Arab Rep.El SalvadorEstoniaEthiopiaEuro areaEurope & Central AsiaEurope & Central Asia (excluding high income)Europe & Central Asia (IDA & IBRD countries)European UnionFijiFinlandFranceGambia, TheGeorgiaGermanyGhanaGreeceGuatemalaHigh incomeHondurasHong Kong SAR, ChinaHungaryIBRD onlyIcelandIDA blendIndiaIndonesiaIran, Islamic Rep.IraqIrelandIsraelItalyJamaicaJapanJordanKazakhstanKenyaKorea, Rep.Late-demographic dividendLatin America & Caribbean Latin America & Caribbean (excluding high income)Latin America & the Caribbean (IDA & IBRD countries)LatviaLebanonLiberiaLithuaniaLuxembourgMacao SAR, ChinaMacedonia, FYRMadagascarMaltaMauritiusMexicoMoldovaMongoliaMoroccoMozambiqueNamibiaNetherlandsNew ZealandNorth AmericaNorwayOECD membersPanamaPapua New GuineaParaguayPeruPolandPortugalPost-demographic dividendRomaniaRussian FederationSan MarinoSao Tome and PrincipeSerbiaSeychellesSlovak RepublicSloveniaSmall statesSouth AfricaSouth AsiaSouth Asia (IDA & IBRD)SpainSri LankaSt. Kitts and NevisSwedenSwitzerlandSyrian Arab RepublicTajikistanThailandTrinidad and TobagoTunisiaTurkeyUkraineUnited Arab EmiratesUnited KingdomUnited StatesUpper middle incomeUruguayVenezuela, RBZambiaZimbabwe

Zeitlinie:

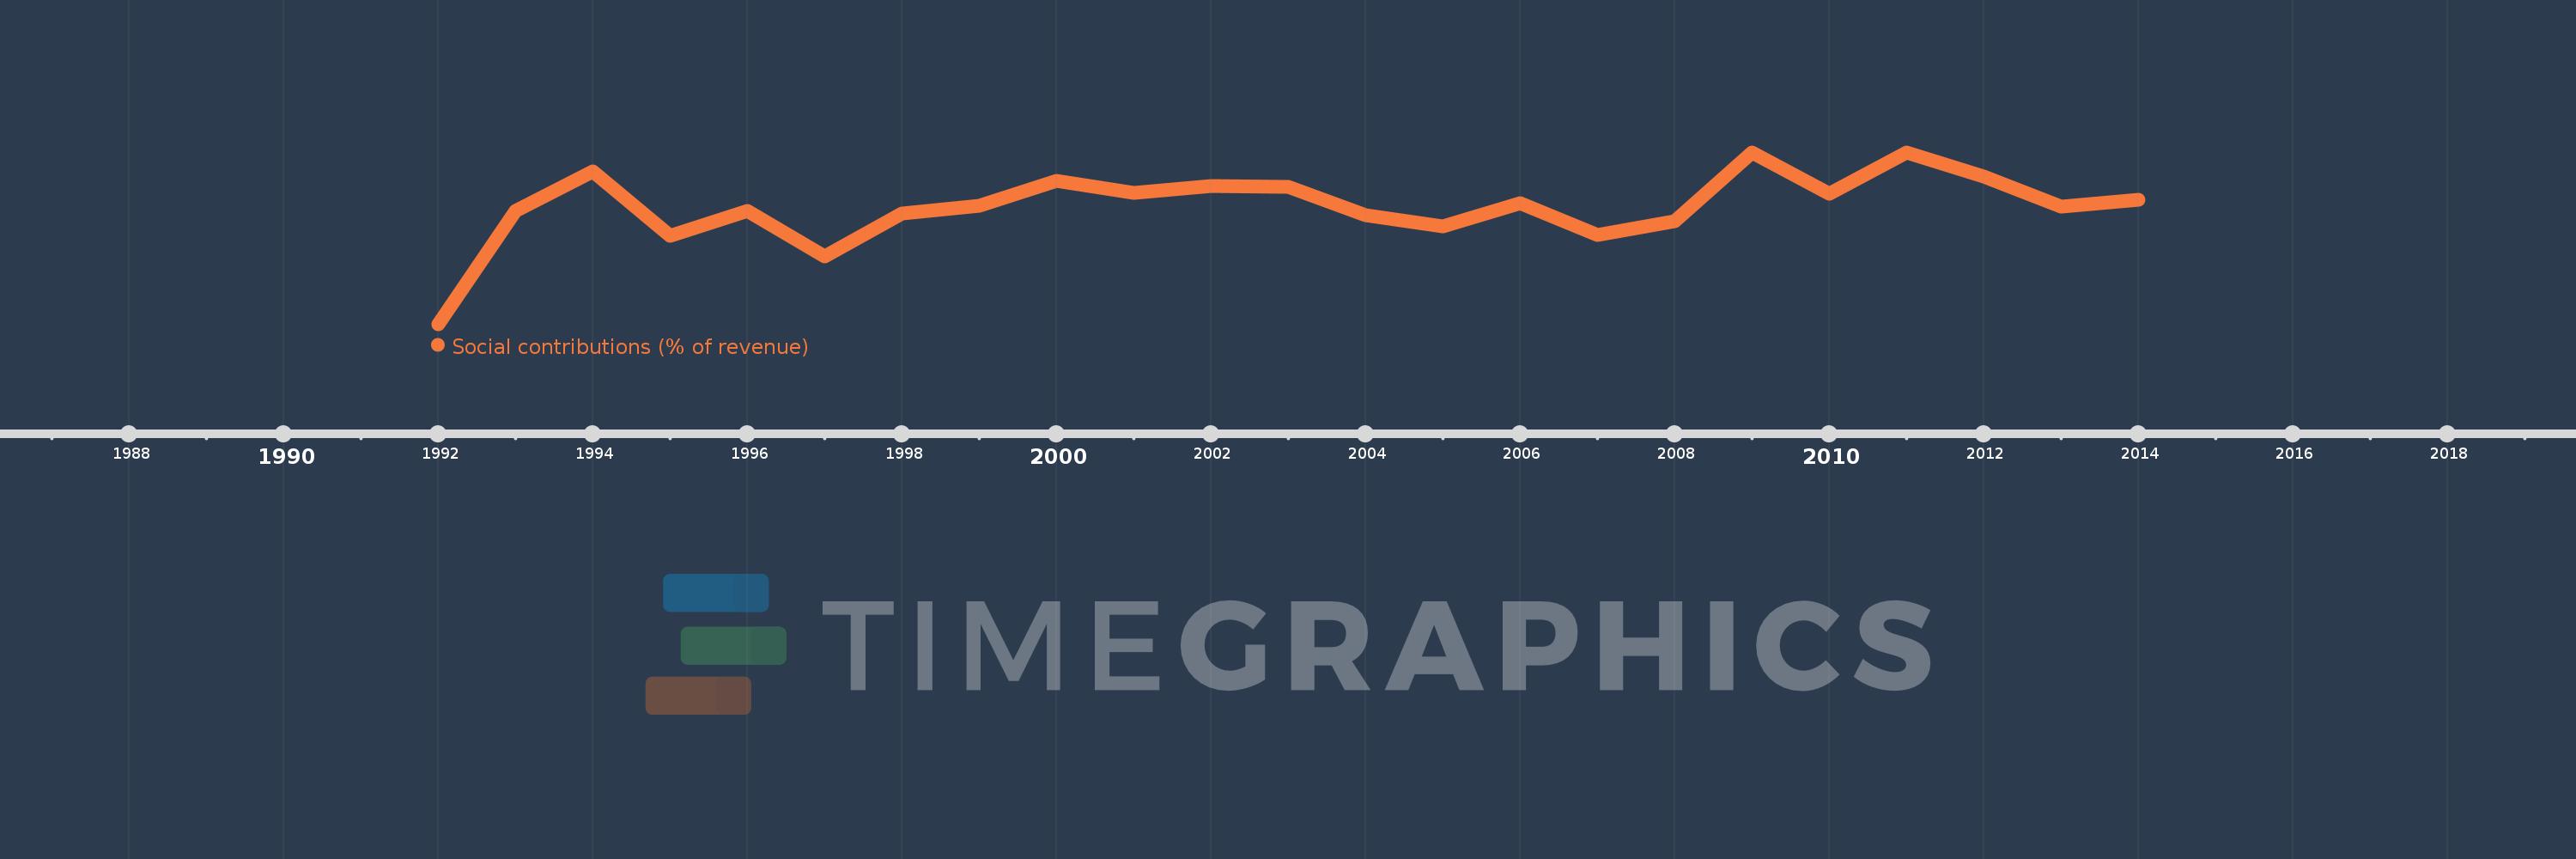
Diese Zeitleiste vorliegt die Graphik ab 1992 J. bis 2014 J. Estonia. Die Angaben bis 1991 J. sind nicht vorhanden. Die Zahl aktueller Beobachtungen nach Daten: 23.

Die Quelle (Bezeichnung):

Kennzahlen der Weltentwicklung

Die Quelle (Einrichtung):

International Monetary Fund, Government Finance Statistics Yearbook and data files.

Kategorien:

Public Sector

Es wurde aktualisiert:

23 Apr 2017 Jahr

Kennzahlen der Wertänderungen vom Jahr zum Jahr

im Durchschnitt:
34.176
Minimum:
27.108
1 Jan 1992 Jahr
Maximum:
37.452
1 Jan 2011 Jahr
Zum Datum der Beobachtung
Wert
Absolute Veränderung
Die Veränderung bezüglich dem vorherigen Wert
1 Jan 1992 Jahr
27.108
+27.108
0.0%
1 Jan 1993 Jahr
33.953
+6.846
25.25%
1 Jan 1994 Jahr
36.302
+2.348
6.92%
1 Jan 1995 Jahr
32.406
-3.896
-10.73%
1 Jan 1996 Jahr
33.925
+1.519
4.69%
1 Jan 1997 Jahr
31.181
-2.744
-8.09%
1 Jan 1998 Jahr
33.8
+2.619
8.4%
1 Jan 1999 Jahr
34.24
+0.439
1.3%
1 Jan 2000 Jahr
35.717
+1.478
4.32%
1 Jan 2001 Jahr
35.024
-0.694
-1.94%
1 Jan 2002 Jahr
35.432
+0.409
1.17%
1 Jan 2003 Jahr
35.39
-0.042
-0.12%
1 Jan 2004 Jahr
33.693
-1.698
-4.8%
1 Jan 2005 Jahr
33.008
-0.685
-2.03%
1 Jan 2006 Jahr
34.411
+1.404
4.25%
1 Jan 2007 Jahr
32.485
-1.927
-5.6%
1 Jan 2008 Jahr
33.327
+0.842
2.59%
1 Jan 2009 Jahr
37.425
+4.098
12.29%
1 Jan 2010 Jahr
34.988
-2.436
-6.51%
1 Jan 2011 Jahr
37.452
+2.464
7.04%
1 Jan 2012 Jahr
35.989
-1.464
-3.91%
1 Jan 2013 Jahr
34.188
-1.8
-5.0%
1 Jan 2014 Jahr
34.605
+0.417
1.22%

Bewertung der Länder gemäß mit laufender Statistik nach Jahren