29
/de/
de
AIzaSyAYiBZKx7MnpbEhh9jyipgxe19OcubqV5w
April 1, 2024
121325
Dominica
DMA
true
2
1
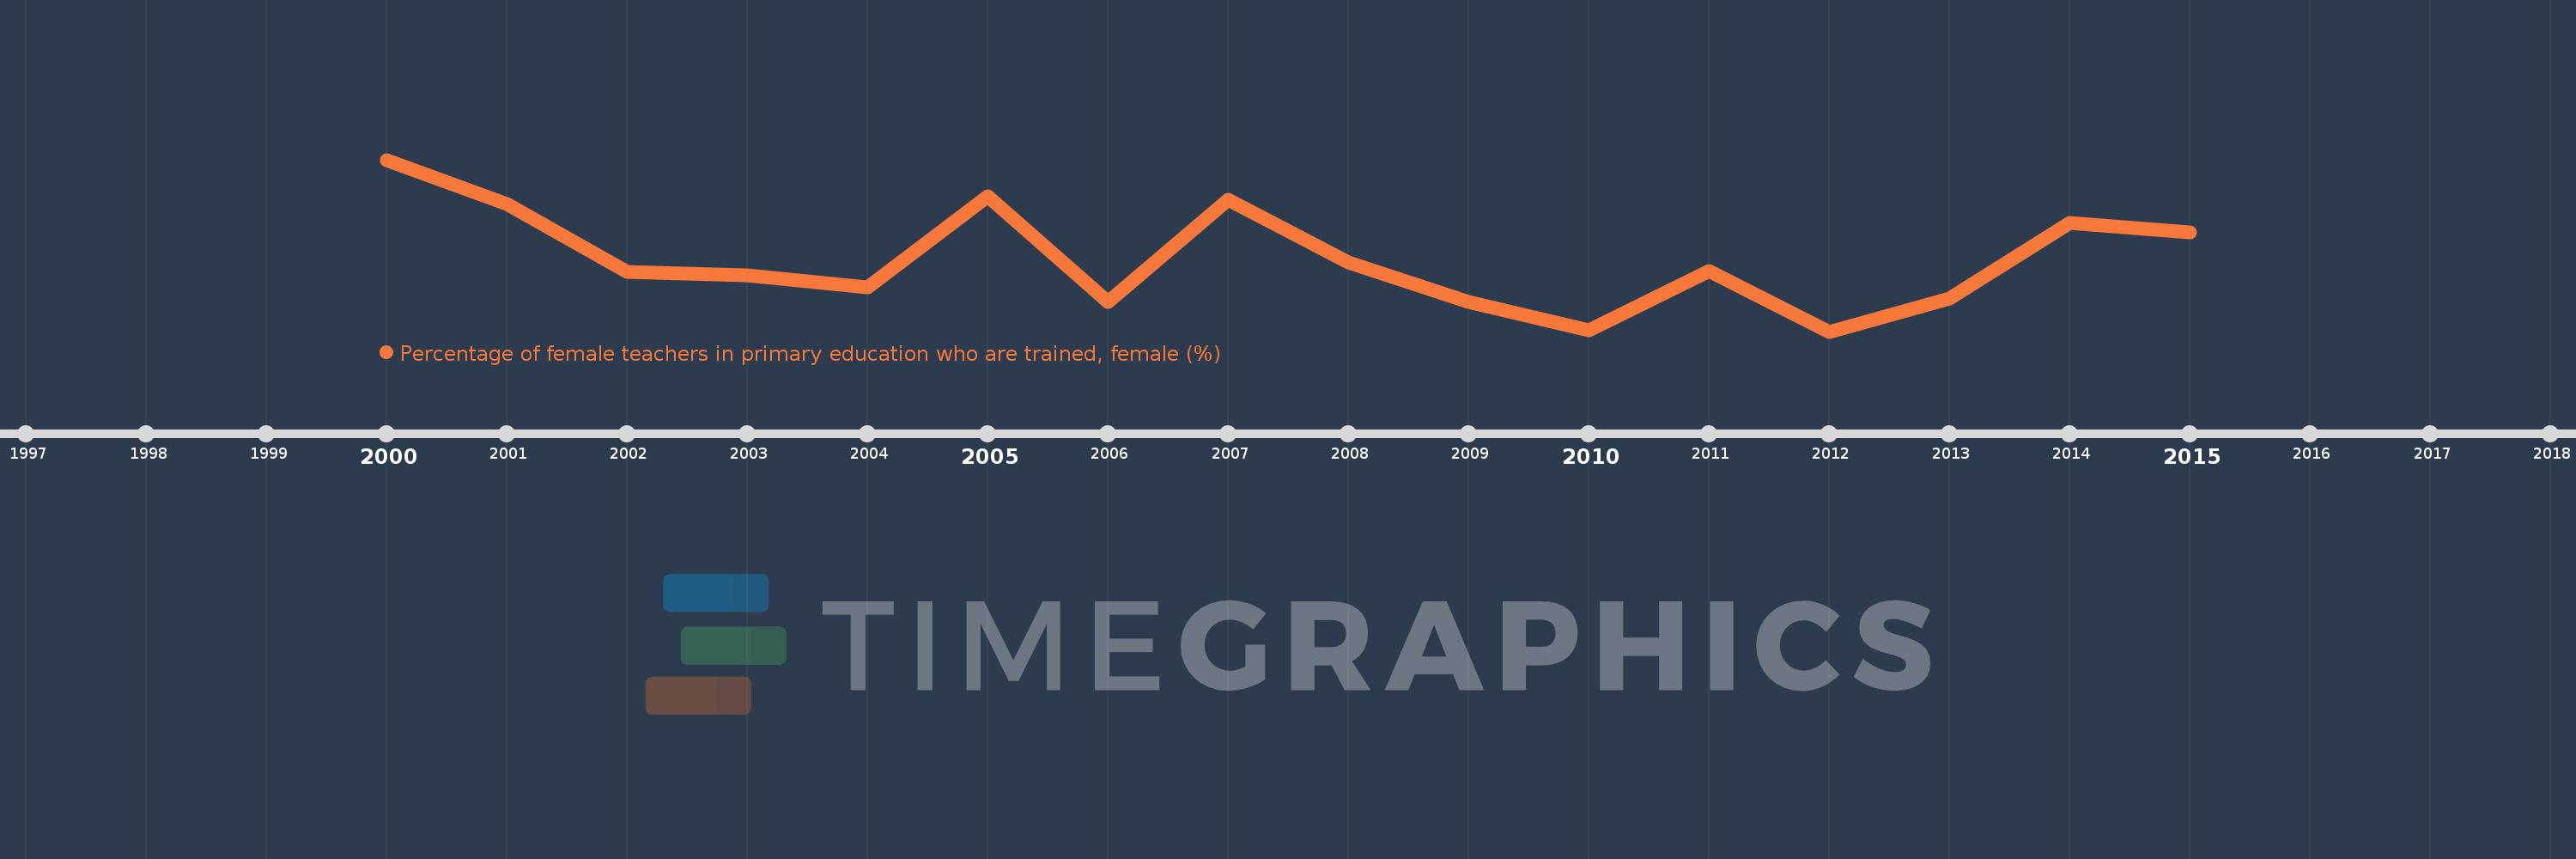
Percentage of female teachers in primary education who are trained, female (%)
2015,2014,2013,2012,2011,2010,2009,2008,2007,2006,2005,2004,2003,2002,2001,2000
Diese Statistik in anderen Ländern:
Zeitlinie:
Diese Zeitleiste vorliegt die Graphik ab 2000 J. bis 2015 J. Dominica. Die Angaben bis 1999 J. sind nicht vorhanden. Die Zahl aktueller Beobachtungen nach Daten: 16.
Die Quelle (Bezeichnung):
Kennzahlen der Weltentwicklung
Die Quelle (Einrichtung):
United Nations Educational, Scientific, and Cultural Organization (UNESCO) Institute for Statistics.
Kategorien:
Education, Gender
Es wurde aktualisiert:
23 Apr 2017 Jahr
Kennzahlen der Wertänderungen vom Jahr zum Jahr
Minimum:
61.048
1 Jan 2012 Jahr
Maximum:
69.935
1 Jan 2000 Jahr
Zum Datum der Beobachtung
Wert
Absolute Veränderung
Die Veränderung bezüglich dem vorherigen Wert
1 Jan 2000 Jahr
69.935
+69.935
0.0%
1 Jan 2001 Jahr
67.635
-2.3
-3.29%
1 Jan 2002 Jahr
64.139
-3.496
-5.17%
1 Jan 2003 Jahr
63.949
-0.191
-0.3%
1 Jan 2004 Jahr
63.341
-0.608
-0.95%
1 Jan 2005 Jahr
68.065
+4.725
7.46%
1 Jan 2006 Jahr
62.585
-5.48
-8.05%
1 Jan 2007 Jahr
67.89
+5.305
8.48%
1 Jan 2008 Jahr
64.608
-3.282
-4.83%
1 Jan 2009 Jahr
62.588
-2.02
-3.13%
1 Jan 2010 Jahr
61.136
-1.452
-2.32%
1 Jan 2011 Jahr
64.172
+3.036
4.97%
1 Jan 2012 Jahr
61.048
-3.125
-4.87%
1 Jan 2013 Jahr
62.754
+1.706
2.79%
1 Jan 2014 Jahr
66.667
+3.913
6.24%
1 Jan 2015 Jahr
66.17
-0.496
-0.74%
Bewertung der Länder gemäß mit laufender Statistik nach Jahren


Kommentare: