33
/pt/
AIzaSyAYiBZKx7MnpbEhh9jyipgxe19OcubqV5w
August 1, 2025
93732
Bulgaria
BGR
true
2
1
Interest payments (% of revenue)
2013,2012,2011,2010,2009,2008,2007,2006,2005,2004,2003,2002,2001,2000,1999,1998,1997,1996,1995,1994,1993,1992,1991
Download
Biblioteca de estatísticas globais →Bulgaria →

Interest payments (% of revenue)

Estas estatísticas em outros países:

AfghanistanAlbaniaAlgeriaAngolaAntigua and BarbudaArab WorldArmeniaAustraliaAustriaAzerbaijanBahamas, TheBahrainBangladeshBarbadosBelarusBelgiumBelizeBeninBhutanBoliviaBosnia and HerzegovinaBotswanaBrazilBulgariaBurkina FasoBurundiCabo VerdeCambodiaCanadaCaribbean small statesCentral African RepublicCentral Europe and the BalticsChileChinaColombiaCongo, Dem. Rep.Congo, Rep.Costa RicaCote d'IvoireCroatiaCyprusCzech RepublicDenmarkDominicaDominican RepublicEarly-demographic dividendEast Asia & PacificEast Asia & Pacific (excluding high income)East Asia & Pacific (IDA & IBRD countries)Egypt, Arab Rep.El SalvadorEquatorial GuineaEstoniaEthiopiaEuro areaEurope & Central AsiaEurope & Central Asia (excluding high income)Europe & Central Asia (IDA & IBRD countries)European UnionFijiFinlandFranceGambia, TheGeorgiaGermanyGhanaGreeceGrenadaGuatemalaHeavily indebted poor countries (HIPC)High incomeHondurasHong Kong SAR, ChinaHungaryIBRD onlyIcelandIDA & IBRD totalIDA blendIDA onlyIDA totalIndiaIndonesiaIran, Islamic Rep.IraqIrelandIsraelItalyJamaicaJapanJordanKazakhstanKenyaKiribatiKorea, Rep.KuwaitKyrgyz RepublicLao PDRLate-demographic dividendLatin America & Caribbean Latin America & Caribbean (excluding high income)Latin America & the Caribbean (IDA & IBRD countries)LatviaLeast developed countries: UN classificationLebanonLesothoLiberiaLithuaniaLow & middle incomeLow incomeLower middle incomeLuxembourgMacao SAR, ChinaMacedonia, FYRMadagascarMalawiMalaysiaMaldivesMaliMaltaMauritiusMexicoMicronesia, Fed. Sts.Middle East & North AfricaMiddle East & North Africa (excluding high income)Middle East & North Africa (IDA & IBRD countries)Middle incomeMoldovaMongoliaMoroccoMozambiqueNamibiaNepalNetherlandsNew ZealandNicaraguaNigeriaNorth AmericaNorwayOECD membersOmanOther small statesPakistanPanamaPapua New GuineaParaguayPeruPhilippinesPolandPortugalPost-demographic dividendPre-demographic dividendQatarRomaniaRussian FederationRwandaSamoaSan MarinoSao Tome and PrincipeSenegalSerbiaSeychellesSierra LeoneSingaporeSlovak RepublicSloveniaSmall statesSolomon IslandsSouth AfricaSouth AsiaSouth Asia (IDA & IBRD)SpainSri LankaSt. Kitts and NevisSt. LuciaSub-Saharan Africa Sub-Saharan Africa (excluding high income)Sub-Saharan Africa (IDA & IBRD countries)SurinameSwazilandSwedenSwitzerlandSyrian Arab RepublicTajikistanTanzaniaThailandTimor-LesteTogoTrinidad and TobagoTunisiaTurkeyUgandaUkraineUnited KingdomUnited StatesUpper middle incomeUruguayVanuatuVenezuela, RBVietnamWest Bank and GazaWorldYemen, Rep.ZambiaZimbabwe

Linha do tempo:

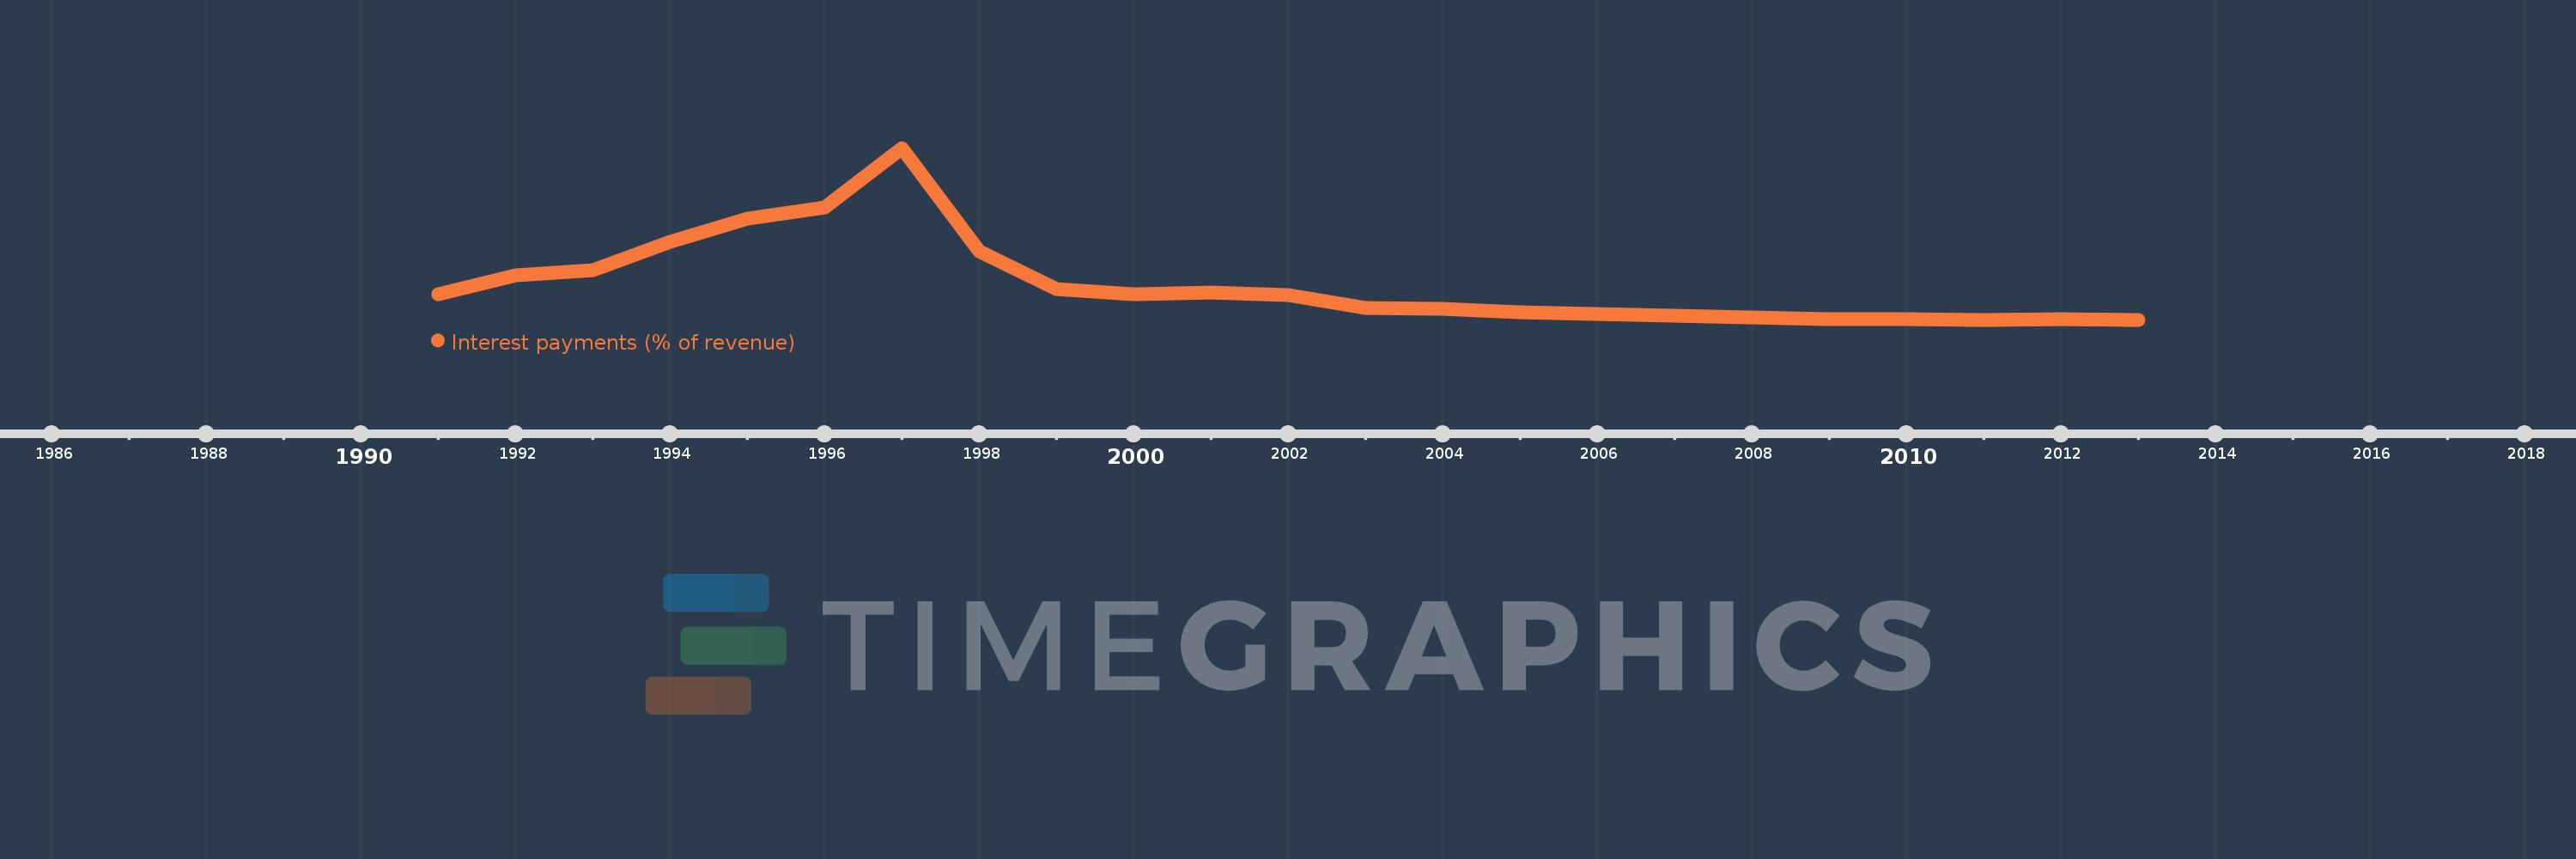
Nesta escala de tempo está apresentado um gráfico de 1991 ano até 2013 ano Bulgaria. Dados de 1990 ano ausente. O número de observações reais por data: 23.

Fonte (nome):

Indicadores de desenvolvimento mundial

Fonte (organização):

International Monetary Fund, Government Finance Statistics Yearbook and data files.

Categorias:

Public Sector

Foi atualizado:

23 abr 2017 ano

Indicadores de alterações dos valores ao longo dos anos

Em média:
14.206
Mínimo:
2.085
1 jan 2013 ano
Máximo:
61.721
1 jan 1997 ano
Na data de observação
Valor
Mudança absoluta
A alteração em relação ao valor anterior
1 jan 1991 ano
10.909
+10.909
0.0%
1 jan 1992 ano
17.577
+6.667
61.12%
1 jan 1993 ano
19.344
+1.767
10.05%
1 jan 1994 ano
29.256
+9.912
51.24%
1 jan 1995 ano
37.289
+8.034
27.46%
1 jan 1996 ano
41.044
+3.754
10.07%
1 jan 1997 ano
61.721
+20.677
50.38%
1 jan 1998 ano
25.807
-35.914
-58.19%
1 jan 1999 ano
12.747
-13.06
-50.61%
1 jan 2000 ano
11.025
-1.722
-13.51%
1 jan 2001 ano
11.563
+0.538
4.88%
1 jan 2002 ano
10.742
-0.82
-7.09%
1 jan 2003 ano
6.307
-4.435
-41.29%
1 jan 2004 ano
5.775
-0.532
-8.43%
1 jan 2005 ano
4.637
-1.138
-19.71%
1 jan 2006 ano
4.028
-0.609
-13.13%
1 jan 2007 ano
3.381
-0.647
-16.05%
1 jan 2008 ano
2.792
-0.59
-17.44%
1 jan 2009 ano
2.273
-0.518
-18.57%
1 jan 2010 ano
2.158
-0.116
-5.09%
1 jan 2011 ano
2.098
-0.06
-2.78%
1 jan 2012 ano
2.176
+0.078
3.72%
1 jan 2013 ano
2.085
-0.091
-4.16%

Classificação de países por estatísticas atuais por anos