29
/pt/
pt
AIzaSyAYiBZKx7MnpbEhh9jyipgxe19OcubqV5w
April 1, 2024
80685
Belarus
BLR
true
2
1
Industry, value added (annual % growth)
2016,2015,2014,2013,2012,2011,2010,2009,2008,2007,2006,2005,2004,2003,2002,2001,2000,1999,1998,1997,1996,1995,1994,1993,1992
Download
Biblioteca de estatísticas globais →Belarus →

Industry, value added (annual % growth)

Estas estatísticas em outros países:
AfghanistanAlbaniaAlgeriaAntigua and BarbudaArab WorldArgentinaArmeniaAustraliaAustriaAzerbaijanBahamas, TheBahrainBangladeshBelarusBelgiumBelizeBeninBermudaBhutanBoliviaBosnia and HerzegovinaBotswanaBrazilBrunei DarussalamBulgariaBurkina FasoBurundiCabo VerdeCambodiaCameroonCanadaCaribbean small statesCayman IslandsCentral African RepublicCentral Europe and the BalticsChadChileChinaColombiaComorosCongo, Dem. Rep.Congo, Rep.Costa RicaCote d'IvoireCroatiaCubaCyprusCzech RepublicDenmarkDjiboutiDominicaDominican RepublicEarly-demographic dividendEast Asia & PacificEast Asia & Pacific (excluding high income)East Asia & Pacific (IDA & IBRD countries)EcuadorEgypt, Arab Rep.El SalvadorEquatorial GuineaEritreaEstoniaEthiopiaEuro areaEurope & Central AsiaEurope & Central Asia (excluding high income)Europe & Central Asia (IDA & IBRD countries)European UnionFijiFinlandFragile and conflict affected situationsFranceGabonGambia, TheGeorgiaGermanyGhanaGreeceGrenadaGuatemalaGuineaGuinea-BissauGuyanaHaitiHeavily indebted poor countries (HIPC)High incomeHondurasHong Kong SAR, ChinaHungaryIBRD onlyIcelandIDA & IBRD totalIDA blendIDA onlyIDA totalIndiaIndonesiaIran, Islamic Rep.IraqIrelandItalyJamaicaJapanJordanKazakhstanKenyaKiribatiKorea, Rep.KosovoKuwaitKyrgyz RepublicLao PDRLate-demographic dividendLatin America & Caribbean Latin America & Caribbean (excluding high income)Latin America & the Caribbean (IDA & IBRD countries)LatviaLeast developed countries: UN classificationLebanonLesothoLiberiaLithuaniaLow & middle incomeLow incomeLower middle incomeLuxembourgMacedonia, FYRMadagascarMalawiMalaysiaMaldivesMaliMarshall IslandsMauritaniaMauritiusMexicoMicronesia, Fed. Sts.Middle East & North AfricaMiddle East & North Africa (excluding high income)Middle East & North Africa (IDA & IBRD countries)Middle incomeMoldovaMongoliaMontenegroMoroccoMozambiqueMyanmarNamibiaNepalNetherlandsNew ZealandNicaraguaNigerNigeriaNorth AmericaNorwayOECD membersOmanOther small statesPacific island small statesPakistanPalauPanamaPapua New GuineaParaguayPeruPhilippinesPolandPortugalPost-demographic dividendPre-demographic dividendPuerto RicoQatarRomaniaRussian FederationRwandaSamoaSao Tome and PrincipeSaudi ArabiaSenegalSerbiaSeychellesSierra LeoneSingaporeSlovak RepublicSloveniaSmall statesSolomon IslandsSomaliaSouth AfricaSouth AsiaSouth Asia (IDA & IBRD)SpainSri LankaSt. Kitts and NevisSt. LuciaSt. Vincent and the GrenadinesSub-Saharan Africa Sub-Saharan Africa (excluding high income)Sub-Saharan Africa (IDA & IBRD countries)SudanSurinameSwazilandSwedenSwitzerlandSyrian Arab RepublicTajikistanTanzaniaThailandTimor-LesteTogoTongaTrinidad and TobagoTunisiaTurkeyTurkmenistanTuvaluUgandaUkraineUnited Arab EmiratesUnited KingdomUnited StatesUpper middle incomeUruguayUzbekistanVanuatuVenezuela, RBVietnamWest Bank and GazaWorldZambiaZimbabwe
Linha do tempo:
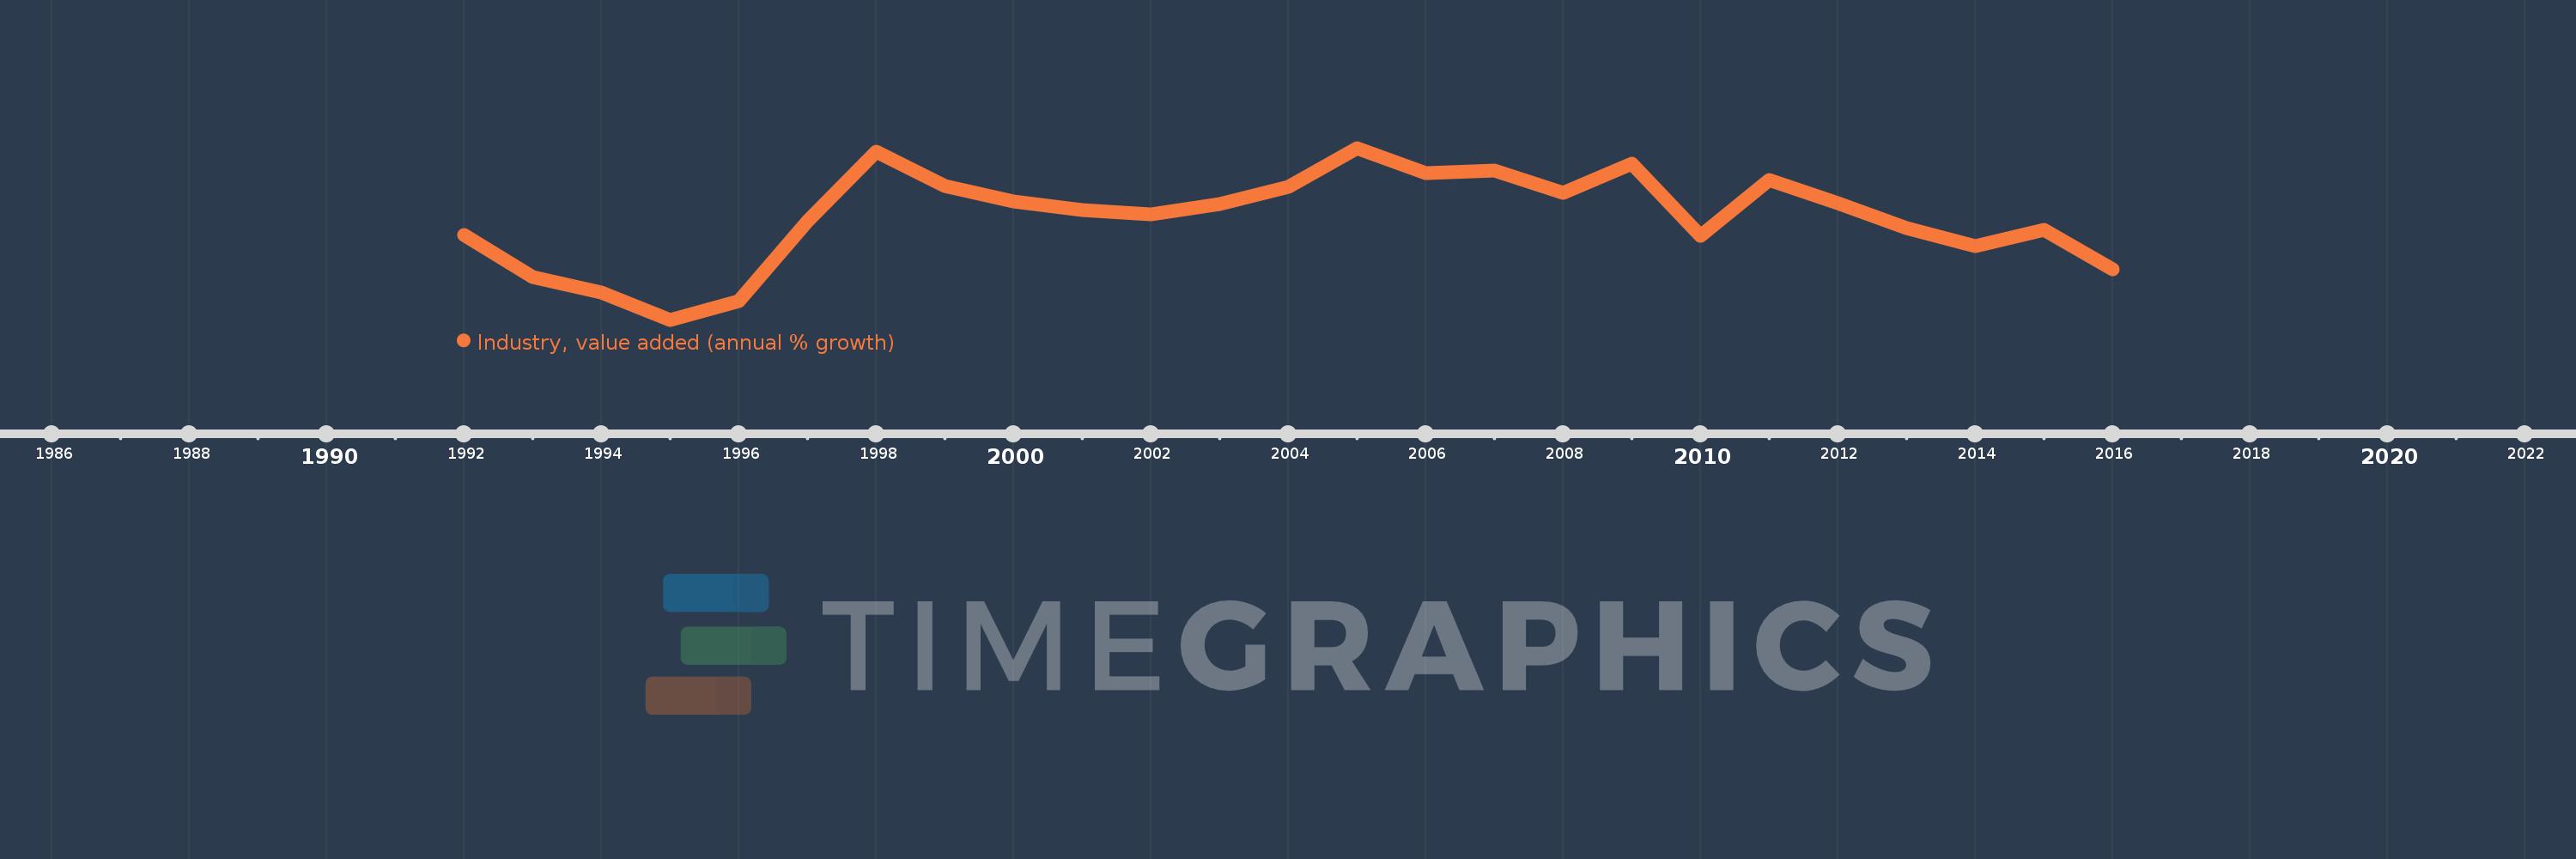
Nesta escala de tempo está apresentado um gráfico de 1992 ano até 2016 ano Belarus. Dados de 1991 ano ausente. O número de observações reais por data: 25.
Fonte (nome):
Indicadores de desenvolvimento mundial
Fonte (organização):
World Bank national accounts data, and OECD National Accounts data files.
Categorias:
Economy & Growth
Foi atualizado:
23 abr 2017 ano
Indicadores de alterações dos valores ao longo dos anos
Em média:
4.132
Mínimo:
-17.361
1 jan 1995 ano
Máximo:
18.83
1 jan 2005 ano
Na data de observação
Valor
Mudança absoluta
A alteração em relação ao valor anterior
1 jan 1992 ano
0.42
+0.42
0.0%
1 jan 1993 ano
-8.389
-8.809
-2.1 mil%
1 jan 1994 ano
-11.713
-3.324
39.62%
1 jan 1995 ano
-17.361
-5.648
48.22%
1 jan 1996 ano
-13.441
+3.92
-22.58%
1 jan 1997 ano
3.373
+16.814
-125.09%
1 jan 1998 ano
17.964
+14.592
432.65%
1 jan 1999 ano
10.842
-7.123
-39.65%
1 jan 2000 ano
7.571
-3.271
-30.17%
1 jan 2001 ano
5.817
-1.754
-23.17%
1 jan 2002 ano
4.8
-1.017
-17.49%
1 jan 2003 ano
6.971
+2.172
45.24%
1 jan 2004 ano
10.618
+3.646
52.3%
1 jan 2005 ano
18.83
+8.212
77.34%
1 jan 2006 ano
13.554
-5.275
-28.02%
1 jan 2007 ano
14.142
+0.588
4.34%
1 jan 2008 ano
9.3
-4.842
-34.24%
1 jan 2009 ano
15.543
+6.243
67.13%
1 jan 2010 ano
0.304
-15.239
-98.05%
1 jan 2011 ano
12.084
+11.78
3.88 mil%
1 jan 2012 ano
7.244
-4.841
-40.06%
1 jan 2013 ano
2.037
-5.206
-71.88%
1 jan 2014 ano
-1.921
-3.958
-194.28%
1 jan 2015 ano
1.501
+3.421
-178.15%
1 jan 2016 ano
-6.798
-8.298
-552.92%
Classificação de países por estatísticas atuais por anos

Comentários:

Enviar
PremiumAbout & FeedbackAcordoPrivacidade
logo
© 2022 Selected Technologies LLC – Morgan Hill, California