33
/pt/
AIzaSyAYiBZKx7MnpbEhh9jyipgxe19OcubqV5w
August 1, 2025
75092
Azerbaijan
AZE
true
2
1
Hospital beds (per 1,000 people)
2013,2012,2010,2008,2007,2006,2004,2002,2001,2000,1999,1998,1997,1996,1995,1994,1993,1992,1991,1990,1989,1988,1987,1986,1981
Download
Biblioteca de estatísticas globais →Azerbaijan →

Hospital beds (per 1,000 people)

Estas estatísticas em outros países:

AfghanistanAlbaniaAlgeriaAndorraAngolaAntigua and BarbudaArab WorldArgentinaArmeniaAustraliaAustriaAzerbaijanBahamas, TheBahrainBangladeshBarbadosBelarusBelgiumBelizeBeninBermudaBhutanBoliviaBosnia and HerzegovinaBotswanaBrazilBrunei DarussalamBulgariaBurkina FasoBurundiCabo VerdeCambodiaCameroonCanadaCaribbean small statesCayman IslandsCentral African RepublicCentral Europe and the BalticsChadChannel IslandsChileChinaColombiaComorosCongo, Dem. Rep.Congo, Rep.Costa RicaCote d'IvoireCroatiaCubaCyprusCzech RepublicDenmarkDjiboutiDominicaDominican RepublicEarly-demographic dividendEast Asia & PacificEast Asia & Pacific (excluding high income)East Asia & Pacific (IDA & IBRD countries)EcuadorEgypt, Arab Rep.El SalvadorEquatorial GuineaEritreaEstoniaEthiopiaEuro areaEurope & Central AsiaEurope & Central Asia (excluding high income)Europe & Central Asia (IDA & IBRD countries)European UnionFijiFinlandFragile and conflict affected situationsFranceGabonGambia, TheGeorgiaGermanyGhanaGreeceGreenlandGrenadaGuatemalaGuineaGuinea-BissauGuyanaHaitiHeavily indebted poor countries (HIPC)High incomeHondurasHong Kong SAR, ChinaHungaryIBRD onlyIcelandIDA & IBRD totalIDA blendIDA onlyIDA totalIndiaIndonesiaIran, Islamic Rep.IraqIrelandIsraelItalyJamaicaJapanJordanKazakhstanKenyaKiribatiKorea, Dem. People’s Rep.Korea, Rep.KuwaitKyrgyz RepublicLao PDRLate-demographic dividendLatin America & Caribbean Latin America & Caribbean (excluding high income)Latin America & the Caribbean (IDA & IBRD countries)LatviaLeast developed countries: UN classificationLebanonLesothoLiberiaLibyaLithuaniaLow & middle incomeLow incomeLower middle incomeLuxembourgMacao SAR, ChinaMacedonia, FYRMadagascarMalawiMalaysiaMaldivesMaliMaltaMarshall IslandsMauritaniaMauritiusMexicoMicronesia, Fed. Sts.Middle East & North AfricaMiddle East & North Africa (excluding high income)Middle East & North Africa (IDA & IBRD countries)Middle incomeMoldovaMonacoMongoliaMontenegroMoroccoMozambiqueMyanmarNamibiaNauruNepalNetherlandsNew ZealandNicaraguaNigerNigeriaNorth AmericaNorwayOECD membersOmanPacific island small statesPakistanPalauPanamaPapua New GuineaParaguayPeruPhilippinesPolandPortugalPost-demographic dividendPre-demographic dividendPuerto RicoQatarRomaniaRussian FederationRwandaSamoaSan MarinoSao Tome and PrincipeSaudi ArabiaSenegalSerbiaSeychellesSierra LeoneSingaporeSlovak RepublicSloveniaSmall statesSolomon IslandsSomaliaSouth AfricaSouth AsiaSouth Asia (IDA & IBRD)SpainSri LankaSt. Kitts and NevisSt. LuciaSt. Vincent and the GrenadinesSub-Saharan Africa Sub-Saharan Africa (excluding high income)Sub-Saharan Africa (IDA & IBRD countries)SudanSurinameSwazilandSwedenSwitzerlandSyrian Arab RepublicTajikistanTanzaniaThailandTimor-LesteTogoTongaTrinidad and TobagoTunisiaTurkeyTurkmenistanTuvaluUgandaUkraineUnited Arab EmiratesUnited KingdomUnited StatesUpper middle incomeUruguayUzbekistanVanuatuVenezuela, RBVietnamVirgin Islands (U.S.)West Bank and GazaWorldYemen, Rep.ZambiaZimbabwe

Linha do tempo:

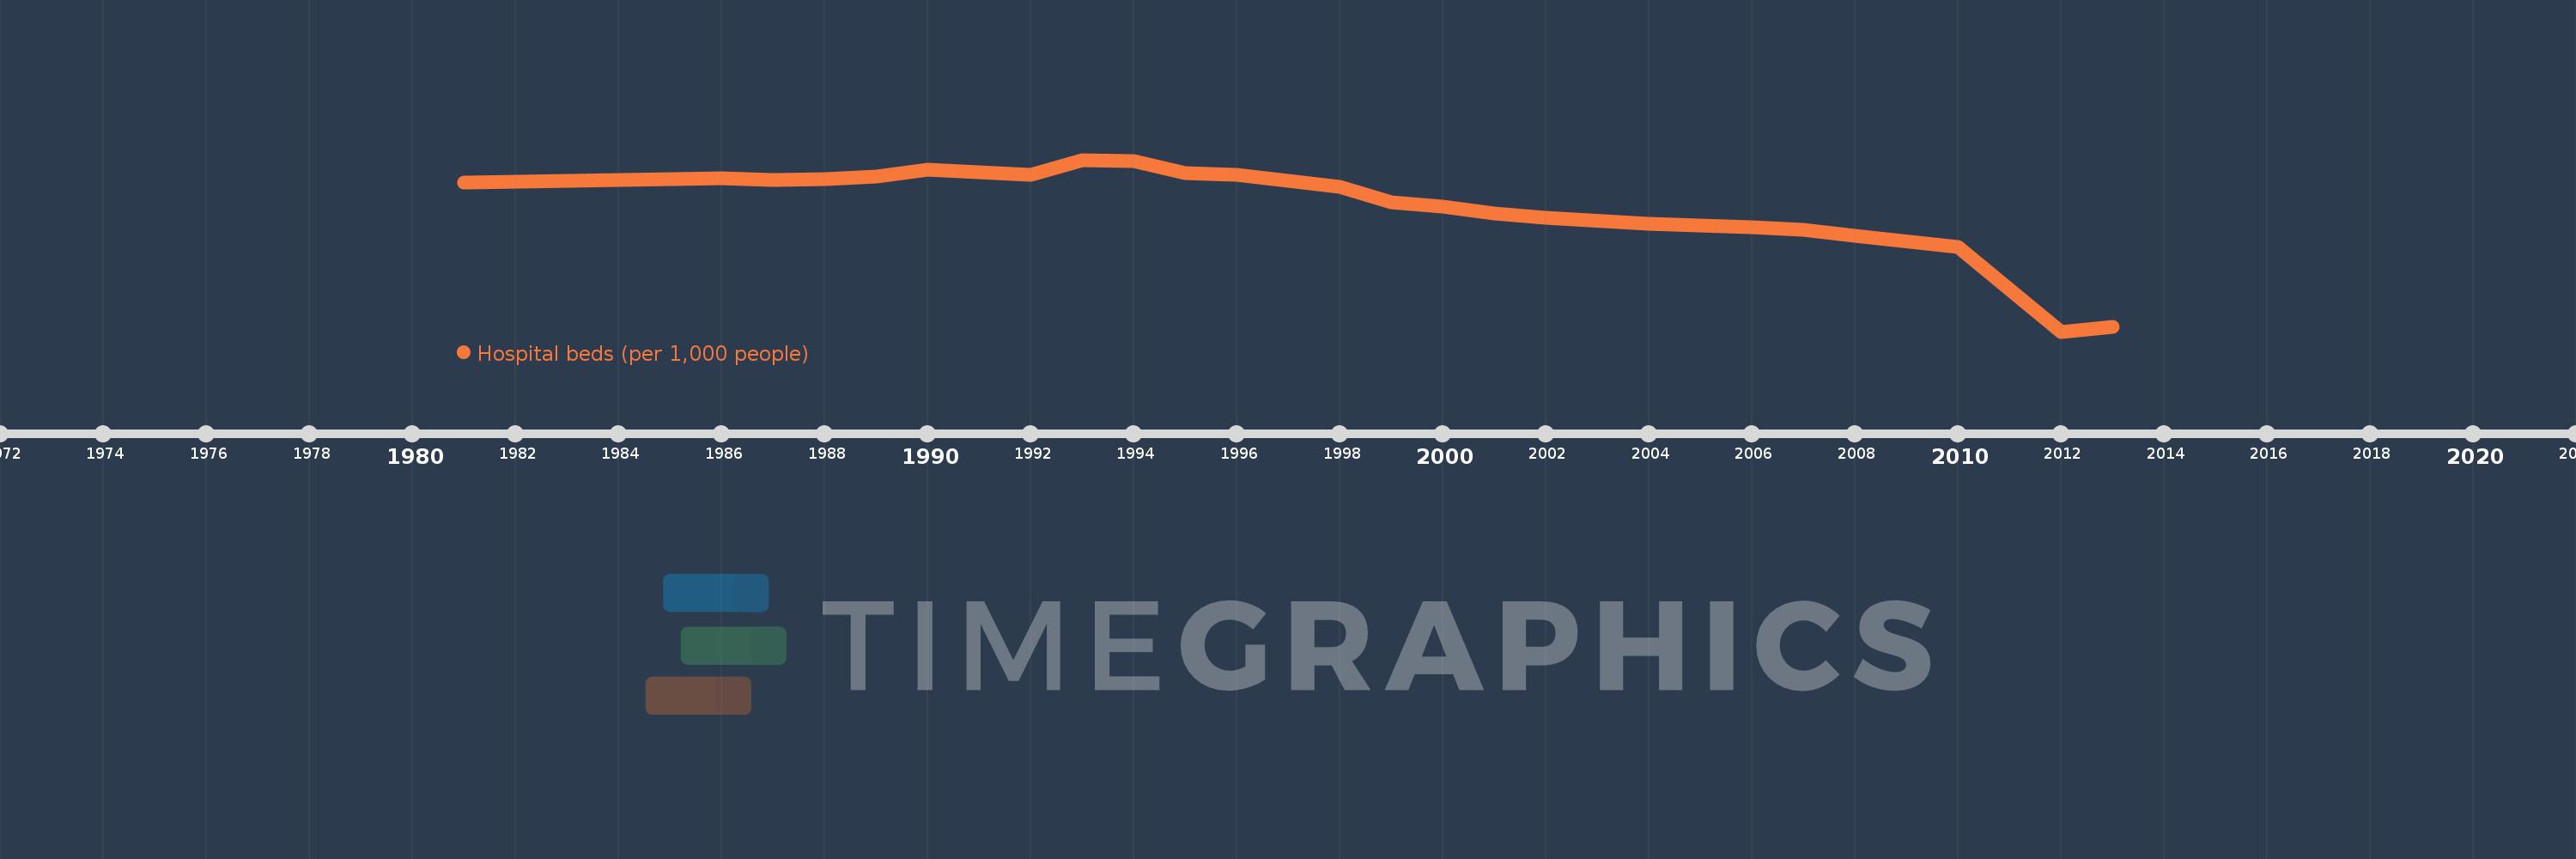
Nesta escala de tempo está apresentado um gráfico de 1981 ano até 2013 ano Azerbaijan. Dados de 1980 ano ausente. O número de observações reais por data: 25.

Fonte (nome):

Indicadores de desenvolvimento mundial

Fonte (organização):

Data are from the World Health Organization, supplemented by country data.

Categorias:

Health

Foi atualizado:

23 abr 2017 ano

Indicadores de alterações dos valores ao longo dos anos

Em média:
8.984
Mínimo:
4.55
1 jan 2012 ano
Máximo:
10.543
1 jan 1993 ano
Na data de observação
Valor
Mudança absoluta
A alteração em relação ao valor anterior
1 jan 1981 ano
9.745
+9.745
0.0%
1 jan 1986 ano
9.897
+0.152
1.56%
1 jan 1987 ano
9.841
-0.056
-0.56%
1 jan 1988 ano
9.882
+0.041
0.42%
1 jan 1989 ano
9.966
+0.084
0.85%
1 jan 1990 ano
10.204
+0.238
2.39%
1 jan 1991 ano
10.099
-0.105
-1.03%
1 jan 1992 ano
10.021
-0.078
-0.78%
1 jan 1993 ano
10.543
+0.522
5.21%
1 jan 1994 ano
10.488
-0.055
-0.52%
1 jan 1995 ano
10.071
-0.417
-3.98%
1 jan 1996 ano
10.02
-0.051
-0.5%
1 jan 1997 ano
9.81
-0.21
-2.1%
1 jan 1998 ano
9.61
-0.2
-2.04%
1 jan 1999 ano
9.06
-0.55
-5.72%
1 jan 2000 ano
8.9
-0.16
-1.77%
1 jan 2001 ano
8.68
-0.22
-2.47%
1 jan 2002 ano
8.51
-0.17
-1.96%
1 jan 2004 ano
8.3
-0.21
-2.47%
1 jan 2006 ano
8.2
-0.1
-1.2%
1 jan 2007 ano
8.1
-0.1
-1.22%
1 jan 2008 ano
7.9
-0.2
-2.47%
1 jan 2010 ano
7.5
-0.4
-5.06%
1 jan 2012 ano
4.55
-2.95
-39.33%
1 jan 2013 ano
4.7
+0.15
3.3%

Classificação de países por estatísticas atuais por anos