29
/pt/
pt
AIzaSyAYiBZKx7MnpbEhh9jyipgxe19OcubqV5w
April 1, 2024
70818
Armenia
ARM
true
2
1
Broad money (% of GDP)
2016,2015,2014,2013,2012,2011,2010,2009,2008,2007,2006,2005,2004,2003,2002,2001,2000,1999,1998,1997,1996,1995,1994,1993
Download
Biblioteca de estatísticas globais →Armenia →

Broad money (% of GDP)

Estas estatísticas em outros países:
AfghanistanAlbaniaAlgeriaAngolaAntigua and BarbudaArab WorldArgentinaArmeniaArubaAustraliaAzerbaijanBahamas, TheBahrainBangladeshBarbadosBelarusBelizeBeninBhutanBoliviaBosnia and HerzegovinaBotswanaBrazilBrunei DarussalamBulgariaBurkina FasoBurundiCabo VerdeCambodiaCameroonCanadaCaribbean small statesCentral African RepublicCentral Europe and the BalticsChadChileChinaColombiaComorosCongo, Dem. Rep.Congo, Rep.Costa RicaCote d'IvoireCroatiaCzech RepublicDenmarkDjiboutiDominicaDominican RepublicEarly-demographic dividendEast Asia & PacificEast Asia & Pacific (excluding high income)East Asia & Pacific (IDA & IBRD countries)EcuadorEgypt, Arab Rep.El SalvadorEquatorial GuineaEritreaEstoniaEthiopiaEurope & Central Asia (excluding high income)Europe & Central Asia (IDA & IBRD countries)FijiFragile and conflict affected situationsGabonGambia, TheGeorgiaGhanaGrenadaGuatemalaGuineaGuinea-BissauGuyanaHaitiHeavily indebted poor countries (HIPC)High incomeHondurasHong Kong SAR, ChinaHungaryIBRD onlyIcelandIDA & IBRD totalIDA blendIDA onlyIDA totalIndiaIndonesiaIran, Islamic Rep.IraqIsraelJamaicaJapanJordanKazakhstanKenyaKorea, Rep.KuwaitKyrgyz RepublicLao PDRLate-demographic dividendLatin America & Caribbean Latin America & Caribbean (excluding high income)Latin America & the Caribbean (IDA & IBRD countries)LatviaLeast developed countries: UN classificationLebanonLesothoLiberiaLibyaLithuaniaLow & middle incomeLow incomeLower middle incomeMacao SAR, ChinaMacedonia, FYRMadagascarMalawiMalaysiaMaldivesMaliMauritaniaMauritiusMexicoMicronesia, Fed. Sts.Middle East & North AfricaMiddle East & North Africa (excluding high income)Middle East & North Africa (IDA & IBRD countries)Middle incomeMoldovaMongoliaMoroccoMozambiqueMyanmarNamibiaNepalNew ZealandNicaraguaNigerNigeriaNorth AmericaNorwayOECD membersOmanOther small statesPacific island small statesPakistanPanamaPapua New GuineaParaguayPeruPhilippinesPolandPost-demographic dividendPre-demographic dividendQatarRomaniaRussian FederationRwandaSamoaSao Tome and PrincipeSaudi ArabiaSenegalSerbiaSeychellesSierra LeoneSingaporeSlovak RepublicSmall statesSolomon IslandsSouth AfricaSouth AsiaSouth Asia (IDA & IBRD)South SudanSri LankaSt. Kitts and NevisSt. LuciaSt. Vincent and the GrenadinesSub-Saharan Africa Sub-Saharan Africa (excluding high income)Sub-Saharan Africa (IDA & IBRD countries)SudanSurinameSwazilandSwedenSwitzerlandSyrian Arab RepublicTajikistanTanzaniaThailandTimor-LesteTogoTongaTrinidad and TobagoTunisiaTurkeyUgandaUkraineUnited Arab EmiratesUnited KingdomUnited StatesUpper middle incomeUruguayVanuatuVenezuela, RBVietnamWest Bank and GazaWorldYemen, Rep.ZambiaZimbabwe
Linha do tempo:
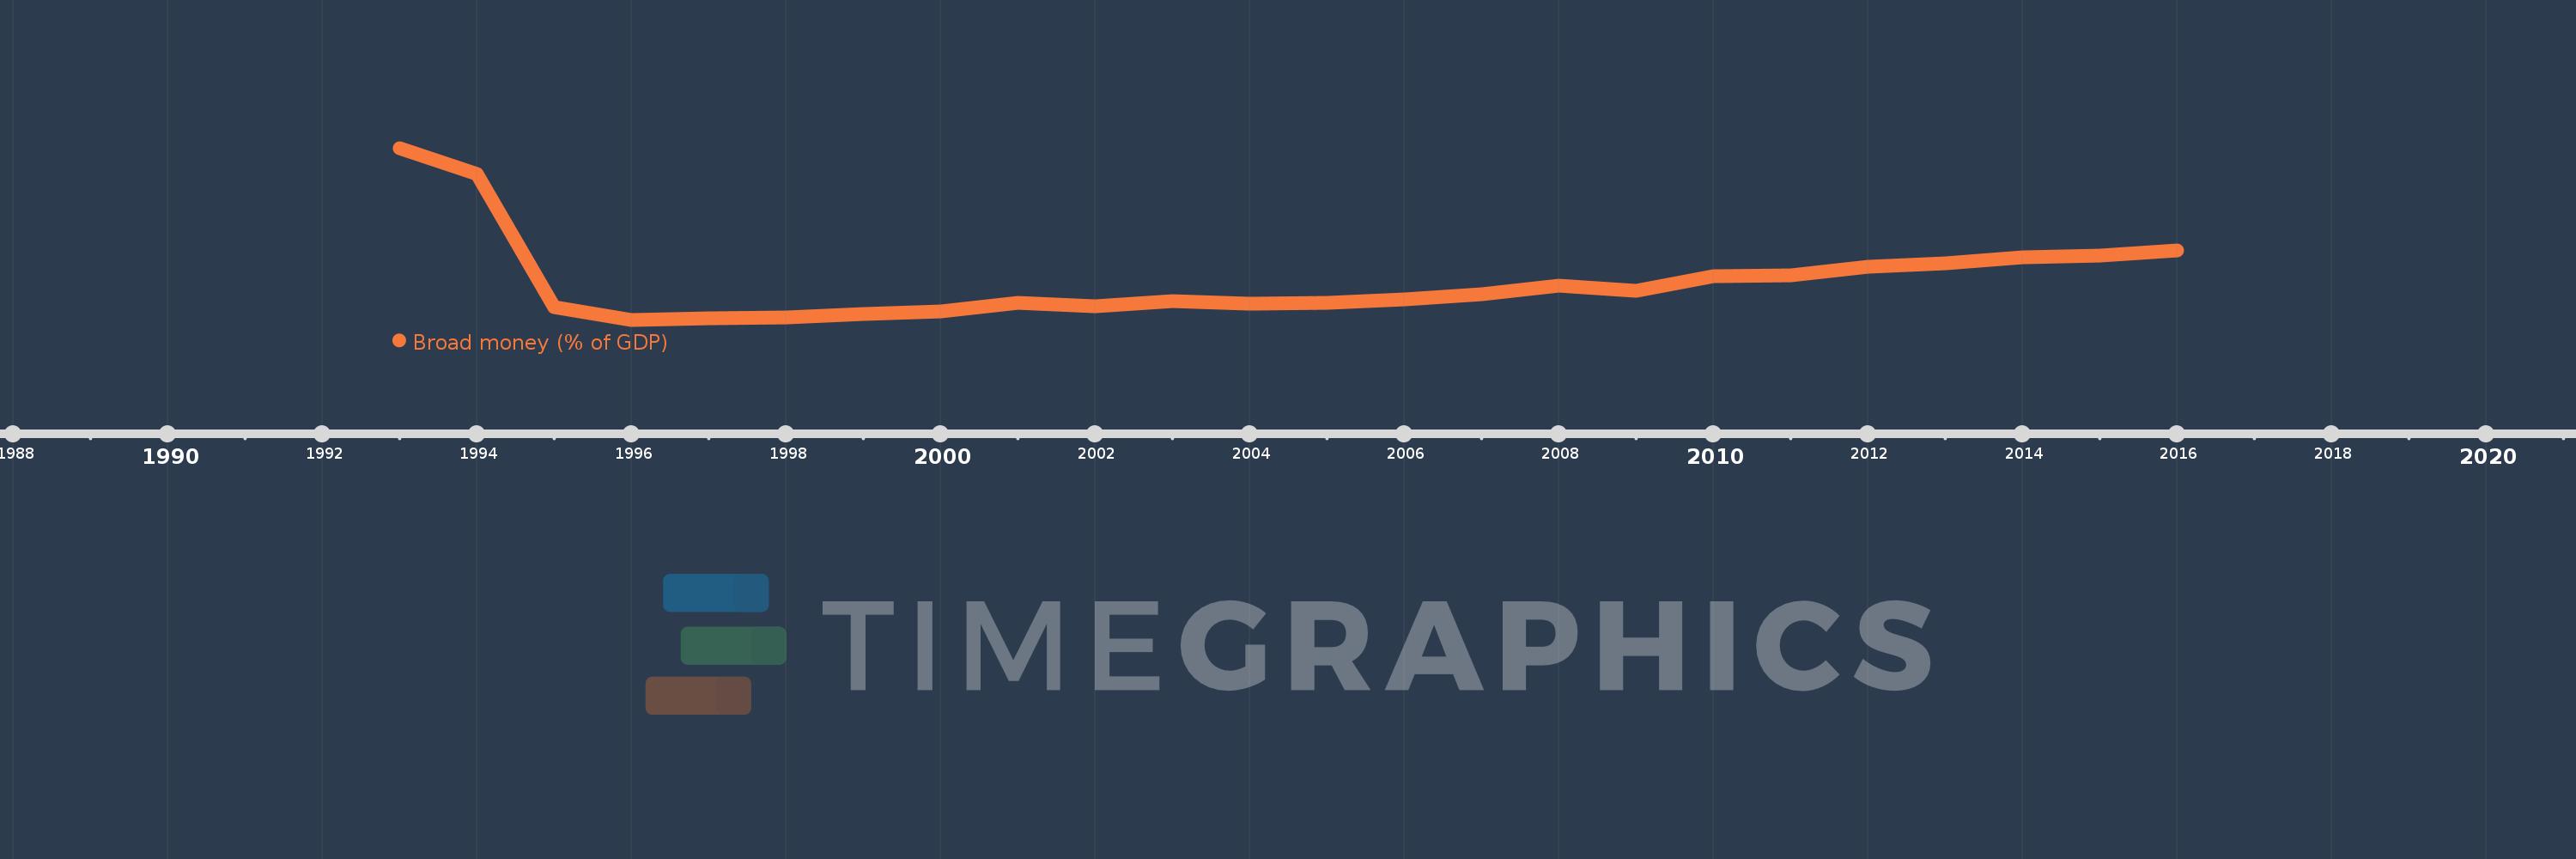
Nesta escala de tempo está apresentado um gráfico de 1993 ano até 2016 ano Armenia. Dados de 1992 ano ausente. O número de observações reais por data: 24.
Fonte (nome):
Indicadores de desenvolvimento mundial
Fonte (organização):
International Monetary Fund, International Financial Statistics and data files, and World Bank and OECD GDP estimates.
Categorias:
Financial Sector
Foi atualizado:
23 abr 2017 ano
Indicadores de alterações dos valores ao longo dos anos
Em média:
24.02
Mínimo:
7.707
1 jan 1996 ano
Máximo:
79.872
1 jan 1993 ano
Na data de observação
Valor
Mudança absoluta
A alteração em relação ao valor anterior
1 jan 1993 ano
79.872
+79.872
0.0%
1 jan 1994 ano
69.114
-10.758
-13.47%
1 jan 1995 ano
13.097
-56.016
-81.05%
1 jan 1996 ano
7.707
-5.39
-41.16%
1 jan 1997 ano
8.223
+0.516
6.69%
1 jan 1998 ano
8.734
+0.511
6.21%
1 jan 1999 ano
10.052
+1.319
15.1%
1 jan 2000 ano
11.085
+1.032
10.27%
1 jan 2001 ano
14.705
+3.62
32.66%
1 jan 2002 ano
13.45
-1.255
-8.53%
1 jan 2003 ano
15.552
+2.102
15.63%
1 jan 2004 ano
14.392
-1.16
-7.46%
1 jan 2005 ano
14.987
+0.595
4.13%
1 jan 2006 ano
16.298
+1.311
8.75%
1 jan 2007 ano
18.287
+1.989
12.2%
1 jan 2008 ano
21.952
+3.665
20.04%
1 jan 2009 ano
19.836
-2.117
-9.64%
1 jan 2010 ano
25.941
+6.106
30.78%
1 jan 2011 ano
26.339
+0.398
1.53%
1 jan 2012 ano
29.83
+3.491
13.26%
1 jan 2013 ano
31.557
+1.727
5.79%
1 jan 2014 ano
33.922
+2.365
7.5%
1 jan 2015 ano
34.672
+0.75
2.21%
1 jan 2016 ano
36.877
+2.205
6.36%
Classificação de países por estatísticas atuais por anos

Comentários:

Enviar
PremiumAbout & FeedbackAcordoPrivacidade
logo
© 2022 Selected Technologies LLC – Morgan Hill, California