33
/pt/
AIzaSyAYiBZKx7MnpbEhh9jyipgxe19OcubqV5w
August 1, 2025
65909
Algeria
DZA
true
2
1
Employment to population ratio, ages 15-24, total (%) (national estimate)
2015,2012,2011,2010
Download
Biblioteca de estatísticas globais →Algeria →

Employment to population ratio, ages 15-24, total (%) (national estimate)

Estas estatísticas em outros países:

AlbaniaAlgeriaArgentinaArmeniaArubaAustraliaAustriaAzerbaijanBangladeshBarbadosBelarusBelgiumBelizeBeninBhutanBoliviaBosnia and HerzegovinaBotswanaBrazilBulgariaCanadaCayman IslandsCentral Europe and the BalticsChileColombiaCosta RicaCroatiaCyprusCzech RepublicDenmarkDominican RepublicEcuadorEgypt, Arab Rep.El SalvadorEstoniaEthiopiaEuro areaEurope & Central AsiaEurope & Central Asia (excluding high income)Europe & Central Asia (IDA & IBRD countries)European UnionFinlandFranceFrench PolynesiaGabonGambia, TheGeorgiaGermanyGreeceGuamGuatemalaGuineaHigh incomeHondurasHong Kong SAR, ChinaHungaryIcelandIndiaIndonesiaIran, Islamic Rep.IrelandIsle of ManIsraelItalyJapanJordanKiribatiKorea, Rep.KosovoKuwaitKyrgyz RepublicLatin America & Caribbean Latin America & Caribbean (excluding high income)Latin America & the Caribbean (IDA & IBRD countries)LatviaLesothoLibyaLithuaniaLuxembourgMacao SAR, ChinaMacedonia, FYRMadagascarMalawiMalaysiaMaldivesMaliMaltaMauritiusMexicoMoldovaMongoliaMontenegroMoroccoMozambiqueNamibiaNetherlandsNew ZealandNorth AmericaNorwayOECD membersOmanPanamaParaguayPeruPolandPortugalPost-demographic dividendPuerto RicoQatarRomaniaRussian FederationSamoaSaudi ArabiaSenegalSerbiaSeychellesSlovak RepublicSloveniaSouth AfricaSouth AsiaSouth Asia (IDA & IBRD)South SudanSpainSri LankaSt. LuciaSt. Vincent and the GrenadinesSudanSurinameSwedenSwitzerlandSyrian Arab RepublicTanzaniaThailandTimor-LesteTrinidad and TobagoTunisiaTurkeyUkraineUnited KingdomUnited StatesUruguayVenezuela, RBVietnamWest Bank and GazaYemen, Rep.ZambiaZimbabwe

Linha do tempo:

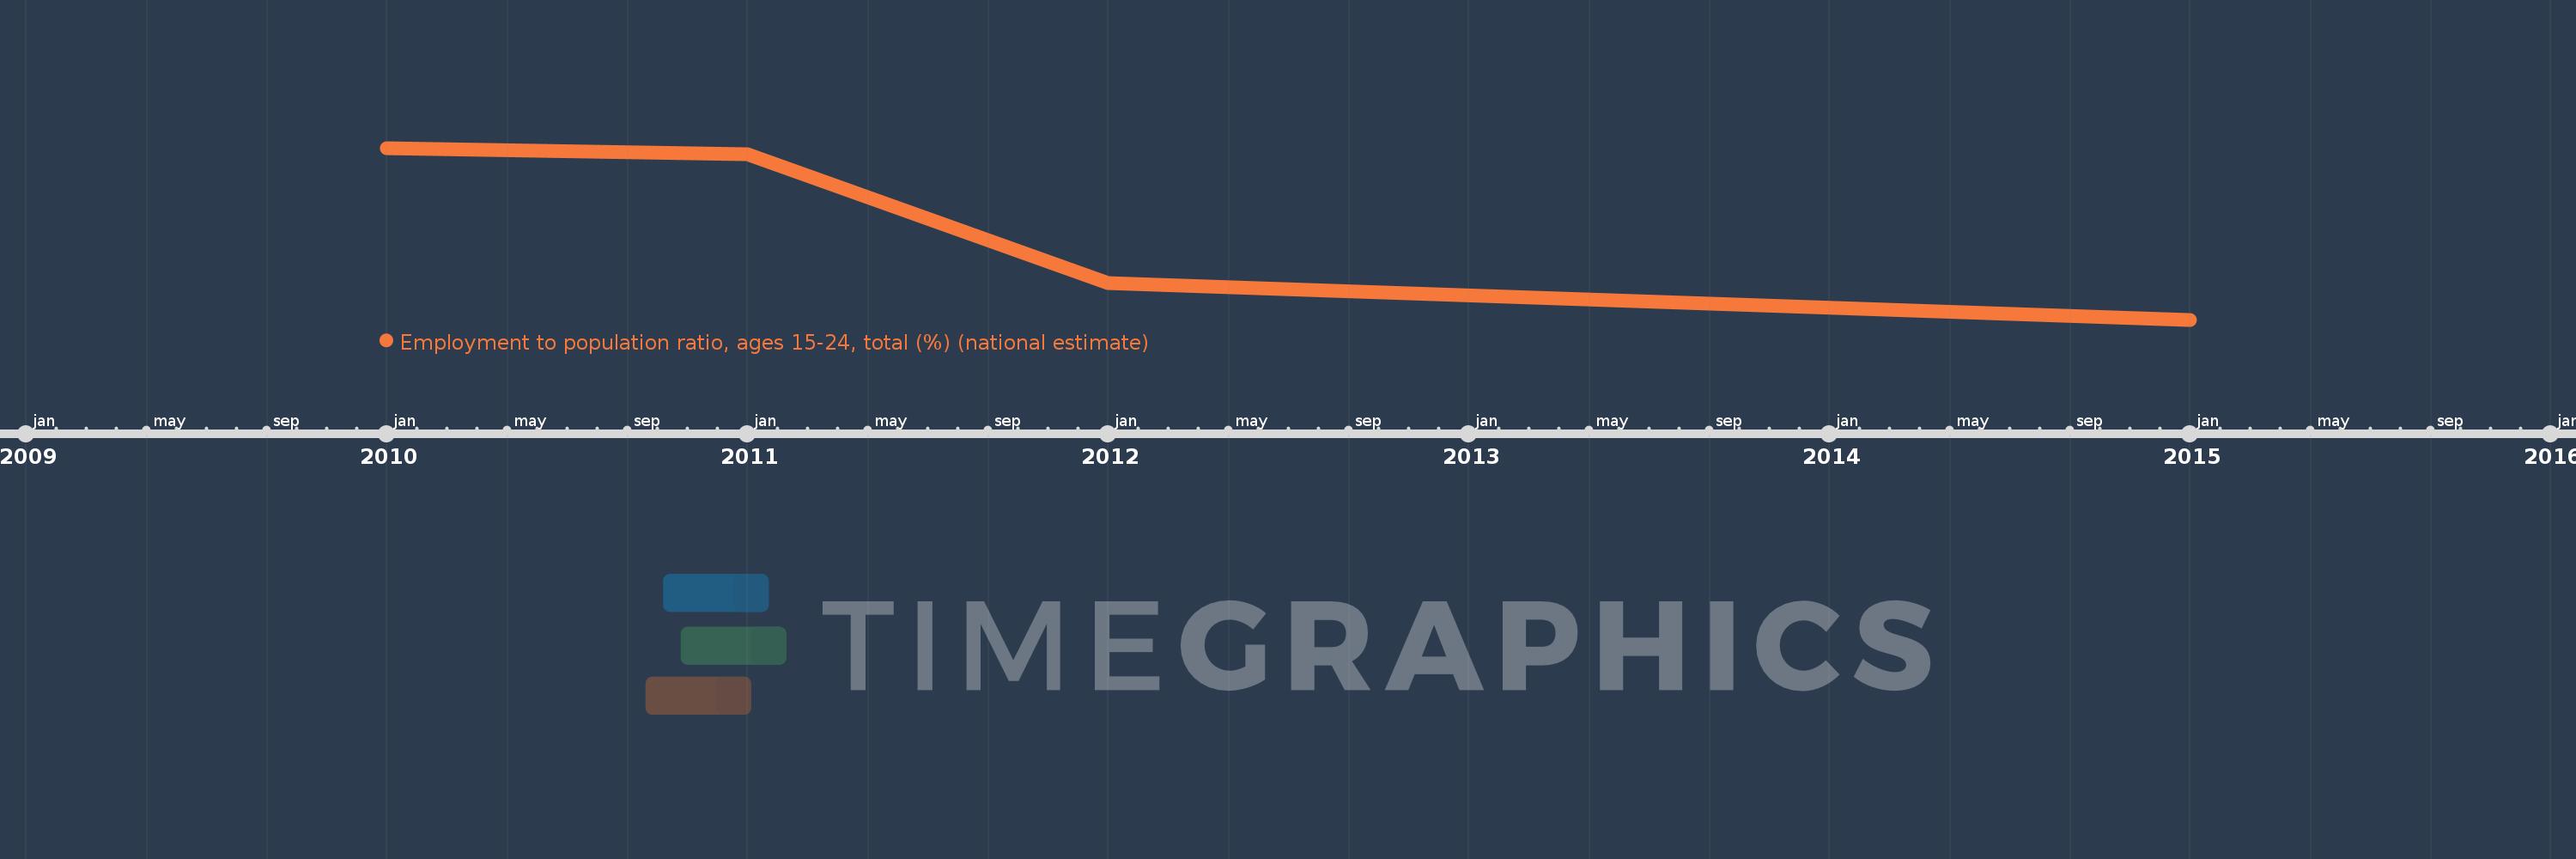
Nesta escala de tempo está apresentado um gráfico de 2010 ano até 2015 ano Algeria. Dados de 2009 ano ausente. O número de observações reais por data: 4.

Fonte (nome):

Indicadores de desenvolvimento mundial

Fonte (organização):

International Labour Organization, Key Indicators of the Labour Market database.

Categorias:

Social Protection & Labor

Foi atualizado:

23 abr 2017 ano

Indicadores de alterações dos valores ao longo dos anos

Em média:
20.925
Mínimo:
19.4
1 jan 2015 ano
Máximo:
22.2
1 jan 2010 ano
Na data de observação
Valor
Mudança absoluta
A alteração em relação ao valor anterior
1 jan 2010 ano
22.2
+22.2
0.0%
1 jan 2011 ano
22.1
-0.1
-0.45%
1 jan 2012 ano
20.0
-2.1
-9.5%
1 jan 2015 ano
19.4
-0.6
-3.0%

Classificação de países por estatísticas atuais por anos