33
/pt/
AIzaSyB4mHJ5NPEv-XzF7P6NDYXjlkCWaeKw5bc
November 1, 2025
60934
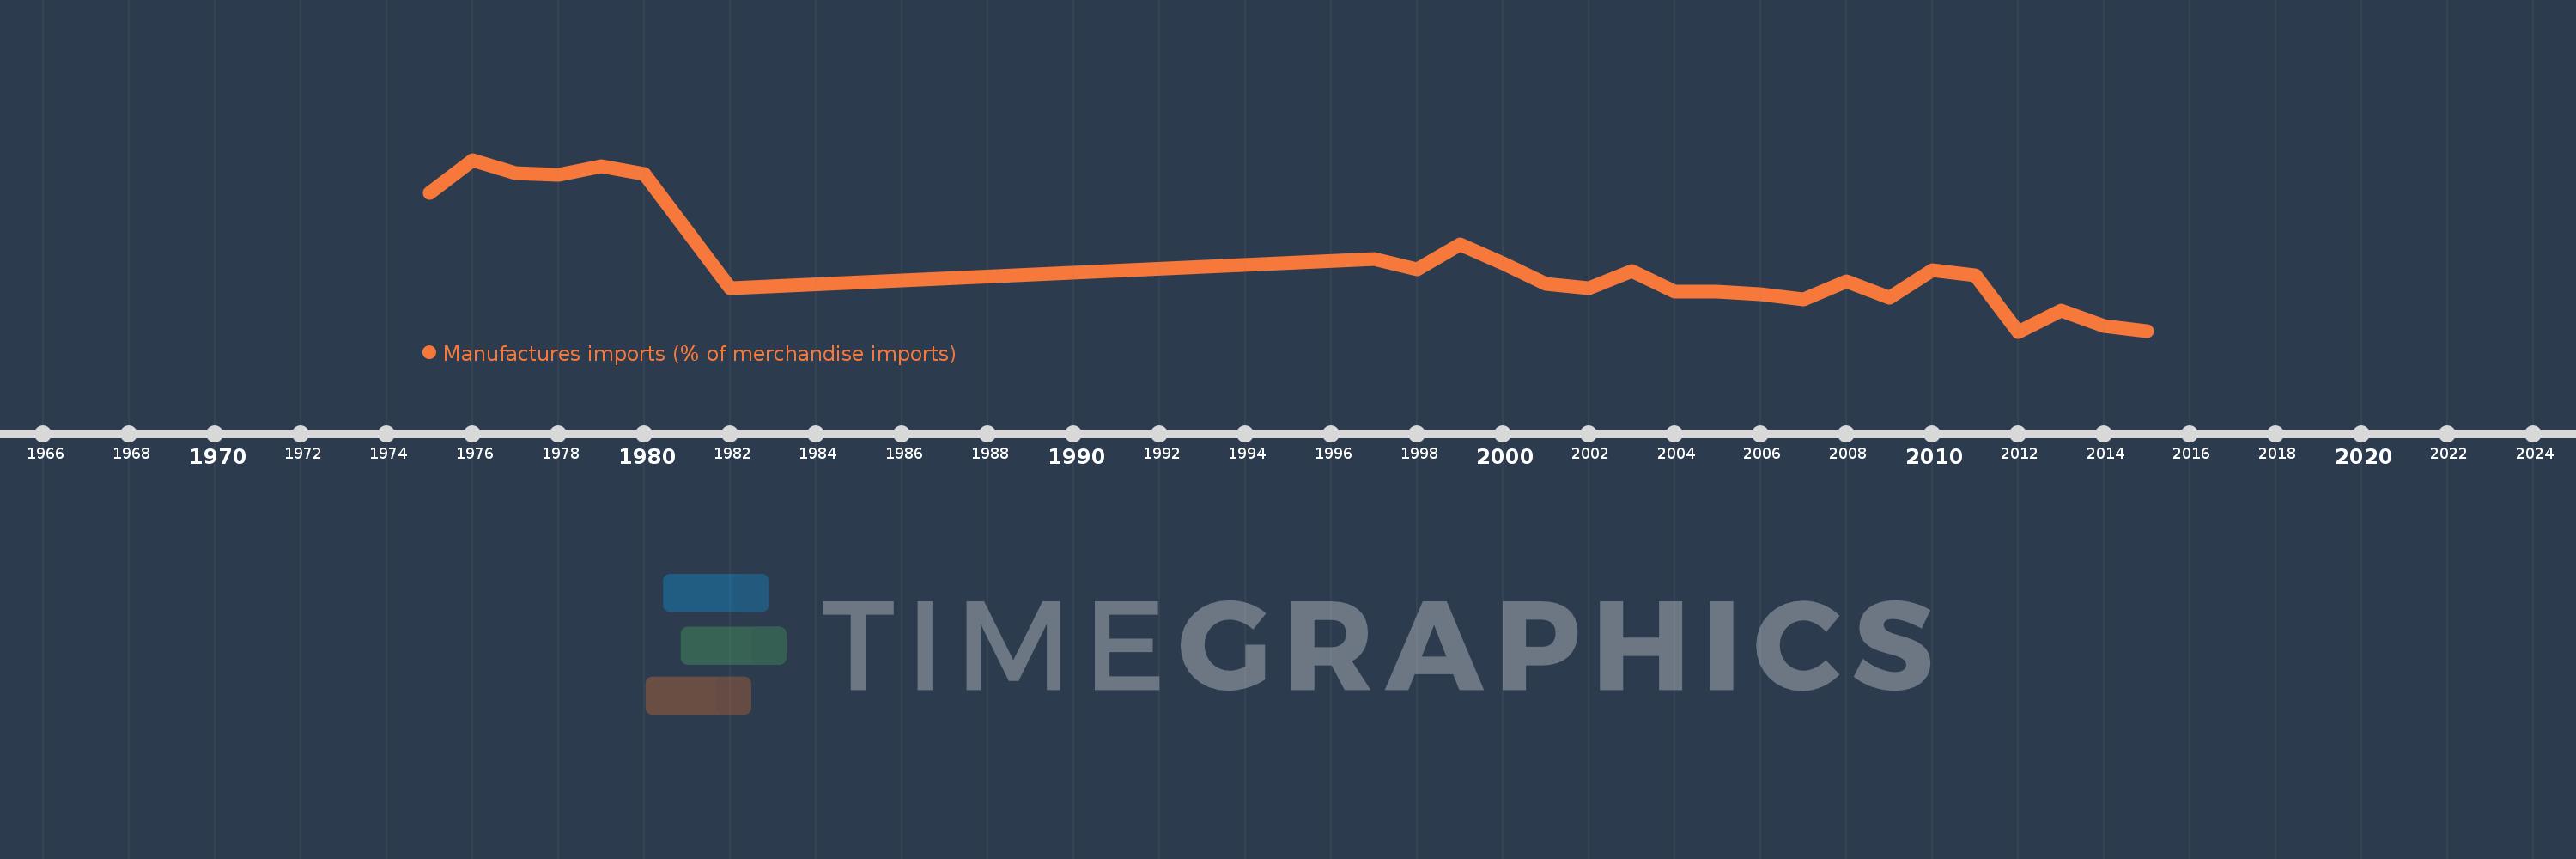
Sub-Saharan Africa (IDA & IBRD countries)
TSS
false
2
1
Manufactures imports (% of merchandise imports)
2015,2014,2013,2012,2011,2010,2009,2008,2007,2006,2005,2004,2003,2002,2001,2000,1999,1998,1997,1982,1980,1979,1978,1977,1976,1975