33
/pt/
AIzaSyAYiBZKx7MnpbEhh9jyipgxe19OcubqV5w
August 1, 2025
54420
Pacific island small states
PSS
false
2
1
School enrollment, secondary, female (% net)
2014,2013,2012,2011,2010,2009,2008,2007,2006,2005,2004,2003,2002,2001,2000,1999
Download
Biblioteca de estatísticas globais →Pacific island small states →

School enrollment, secondary, female (% net)

Estas estatísticas em outros países:

AfghanistanAlbaniaAlgeriaAngolaAntigua and BarbudaArab WorldArgentinaArmeniaArubaAustraliaAzerbaijanBahamas, TheBahrainBangladeshBarbadosBelarusBelgiumBelizeBeninBermudaBhutanBoliviaBotswanaBrazilBrunei DarussalamBulgariaBurkina FasoBurundiCabo VerdeCambodiaCameroonCanadaCaribbean small statesCentral African RepublicCentral Europe and the BalticsChadChileColombiaComorosCongo, Dem. Rep.Congo, Rep.Costa RicaCroatiaCubaCyprusDenmarkDjiboutiDominicaDominican RepublicEarly-demographic dividendEast Asia & PacificEast Asia & Pacific (excluding high income)East Asia & Pacific (IDA & IBRD countries)EcuadorEgypt, Arab Rep.El SalvadorEquatorial GuineaEritreaEstoniaEthiopiaEuro areaEurope & Central AsiaEurope & Central Asia (excluding high income)Europe & Central Asia (IDA & IBRD countries)European UnionFijiFinlandFragile and conflict affected situationsFranceGambia, TheGeorgiaGhanaGreeceGrenadaGuatemalaGuineaGuinea-BissauGuyanaHeavily indebted poor countries (HIPC)High incomeHondurasHong Kong SAR, ChinaHungaryIBRD onlyIcelandIDA & IBRD totalIDA blendIDA onlyIDA totalIndiaIndonesiaIran, Islamic Rep.IraqIrelandIsraelItalyJamaicaJapanJordanKazakhstanKenyaKiribatiKorea, Rep.KuwaitKyrgyz RepublicLao PDRLate-demographic dividendLatin America & Caribbean Latin America & Caribbean (excluding high income)Latin America & the Caribbean (IDA & IBRD countries)LatviaLeast developed countries: UN classificationLebanonLesothoLibyaLiechtensteinLithuaniaLow & middle incomeLow incomeLower middle incomeLuxembourgMacao SAR, ChinaMacedonia, FYRMadagascarMalawiMaldivesMaliMaltaMarshall IslandsMauritaniaMauritiusMexicoMiddle East & North AfricaMiddle East & North Africa (excluding high income)Middle East & North Africa (IDA & IBRD countries)Middle incomeMoldovaMongoliaMoroccoMozambiqueMyanmarNamibiaNauruNepalNetherlandsNew ZealandNicaraguaNigerNorth AmericaNorwayOECD membersOmanOther small statesPacific island small statesPakistanPanamaParaguayPeruPhilippinesPolandPortugalPost-demographic dividendPre-demographic dividendPuerto RicoQatarRomaniaSamoaSao Tome and PrincipeSaudi ArabiaSenegalSerbiaSeychellesSierra LeoneSloveniaSmall statesSolomon IslandsSomaliaSouth AfricaSouth AsiaSouth Asia (IDA & IBRD)SpainSri LankaSt. Kitts and NevisSt. LuciaSt. Vincent and the GrenadinesSub-Saharan Africa Sub-Saharan Africa (excluding high income)Sub-Saharan Africa (IDA & IBRD countries)SurinameSwazilandSwedenSwitzerlandSyrian Arab RepublicTajikistanThailandTimor-LesteTogoTongaTrinidad and TobagoTunisiaTurkeyTuvaluUgandaUkraineUnited Arab EmiratesUnited KingdomUnited StatesUpper middle incomeUruguayVanuatuVenezuela, RBWest Bank and GazaWorldYemen, Rep.Zimbabwe

Linha do tempo:

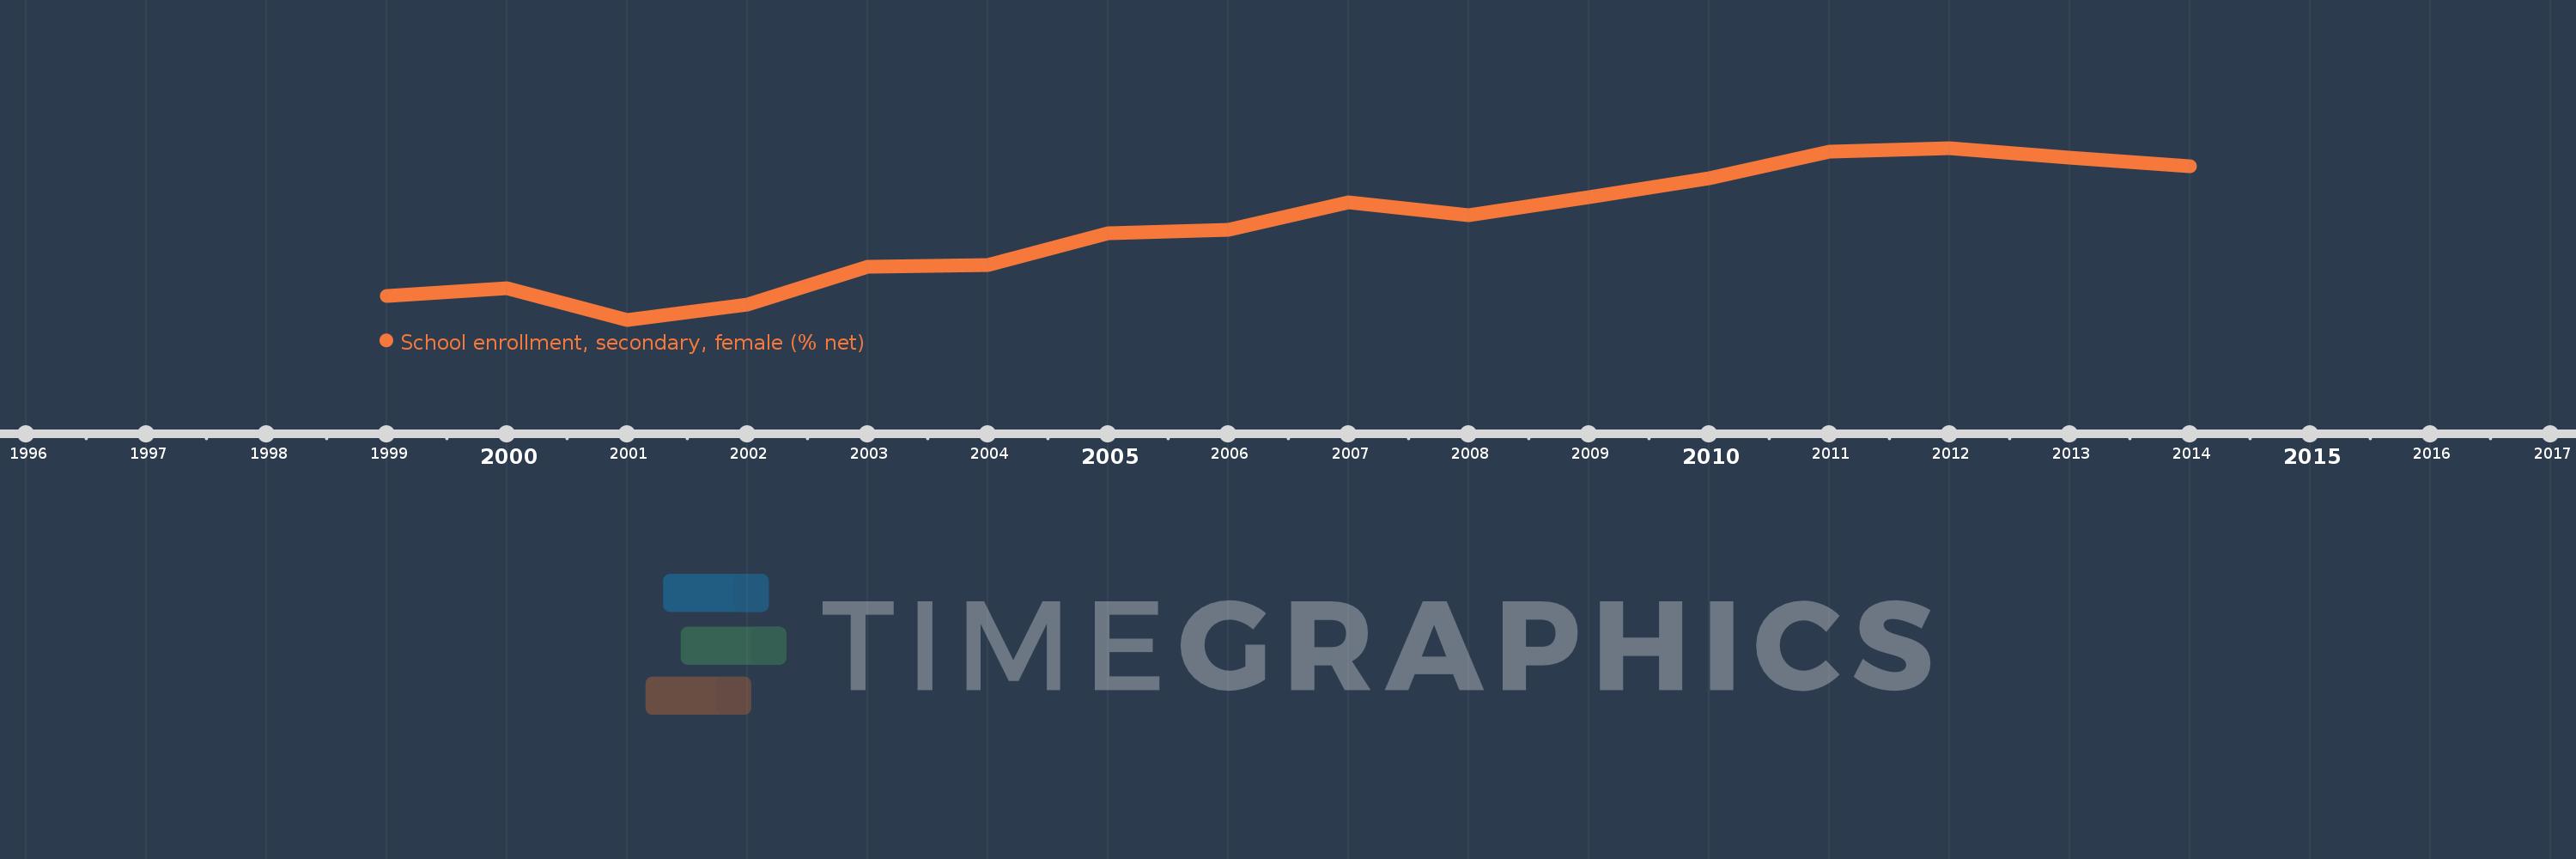
Nesta escala de tempo está apresentado um gráfico de 1999 ano até 2014 ano Pacific island small states. Dados de 1998 ano ausente. O número de observações reais por data: 16.

Fonte (nome):

Indicadores de desenvolvimento mundial

Fonte (organização):

United Nations Educational, Scientific, and Cultural Organization (UNESCO) Institute for Statistics.

Categorias:

Education, Gender

Foi atualizado:

23 abr 2017 ano

Indicadores de alterações dos valores ao longo dos anos

Em média:
64.324
Mínimo:
57.51
1 jan 2001 ano
Máximo:
70.033
1 jan 2012 ano
Na data de observação
Valor
Mudança absoluta
A alteração em relação ao valor anterior
1 jan 1999 ano
59.25
+59.25
0.0%
1 jan 2000 ano
59.832
+0.581
0.98%
1 jan 2001 ano
57.51
-2.321
-3.88%
1 jan 2002 ano
58.602
+1.092
1.9%
1 jan 2003 ano
61.394
+2.792
4.76%
1 jan 2004 ano
61.521
+0.127
0.21%
1 jan 2005 ano
63.808
+2.287
3.72%
1 jan 2006 ano
64.058
+0.251
0.39%
1 jan 2007 ano
66.043
+1.985
3.1%
1 jan 2008 ano
65.119
-0.924
-1.4%
1 jan 2009 ano
66.426
+1.307
2.01%
1 jan 2010 ano
67.81
+1.384
2.08%
1 jan 2011 ano
69.749
+1.939
2.86%
1 jan 2012 ano
70.033
+0.285
0.41%
1 jan 2013 ano
69.323
-0.711
-1.01%
1 jan 2014 ano
68.714
-0.608
-0.88%

Classificação de países por estatísticas atuais por anos