30
/pt/
AIzaSyAYiBZKx7MnpbEhh9jyipgxe19OcubqV5w
April 1, 2024
50766
Middle income
MIC
false
2
1
CPIA social protection rating (1=low to 6=high)
2016,2015,2014,2013,2012,2011,2010,2009,2008,2007,2006
Download
Biblioteca de estatísticas globais →Middle income →

CPIA social protection rating (1=low to 6=high)

Estas estatísticas em outros países:

AfghanistanAngolaArab WorldArmeniaAzerbaijanBangladeshBeninBhutanBoliviaBosnia and HerzegovinaBurkina FasoBurundiCabo VerdeCambodiaCameroonCaribbean small statesCentral African RepublicChadComorosCongo, Dem. Rep.Congo, Rep.Cote d'IvoireDjiboutiDominicaEarly-demographic dividendEast Asia & PacificEast Asia & Pacific (excluding high income)East Asia & Pacific (IDA & IBRD countries)EritreaEthiopiaEurope & Central AsiaEurope & Central Asia (excluding high income)Europe & Central Asia (IDA & IBRD countries)Fragile and conflict affected situationsGambia, TheGeorgiaGhanaGrenadaGuineaGuinea-BissauGuyanaHaitiHeavily indebted poor countries (HIPC)HondurasIBRD onlyIDA & IBRD totalIDA blendIDA onlyIDA totalIndiaKenyaKiribatiKosovoKyrgyz RepublicLao PDRLate-demographic dividendLatin America & Caribbean Latin America & Caribbean (excluding high income)Latin America & the Caribbean (IDA & IBRD countries)Least developed countries: UN classificationLesothoLiberiaLow & middle incomeLow incomeLower middle incomeMadagascarMalawiMaldivesMaliMarshall IslandsMauritaniaMicronesia, Fed. Sts.Middle East & North AfricaMiddle East & North Africa (excluding high income)Middle East & North Africa (IDA & IBRD countries)Middle incomeMoldovaMongoliaMozambiqueMyanmarNepalNicaraguaNigerNigeriaOther small statesPacific island small statesPakistanPapua New GuineaPost-demographic dividendPre-demographic dividendRwandaSamoaSao Tome and PrincipeSenegalSerbiaSierra LeoneSmall statesSolomon IslandsSouth AsiaSouth Asia (IDA & IBRD)South SudanSri LankaSt. LuciaSt. Vincent and the GrenadinesSub-Saharan Africa Sub-Saharan Africa (excluding high income)Sub-Saharan Africa (IDA & IBRD countries)SudanTajikistanTanzaniaTimor-LesteTogoTongaTuvaluUgandaUpper middle incomeUzbekistanVanuatuVietnamWorldYemen, Rep.ZambiaZimbabwe

Linha do tempo:

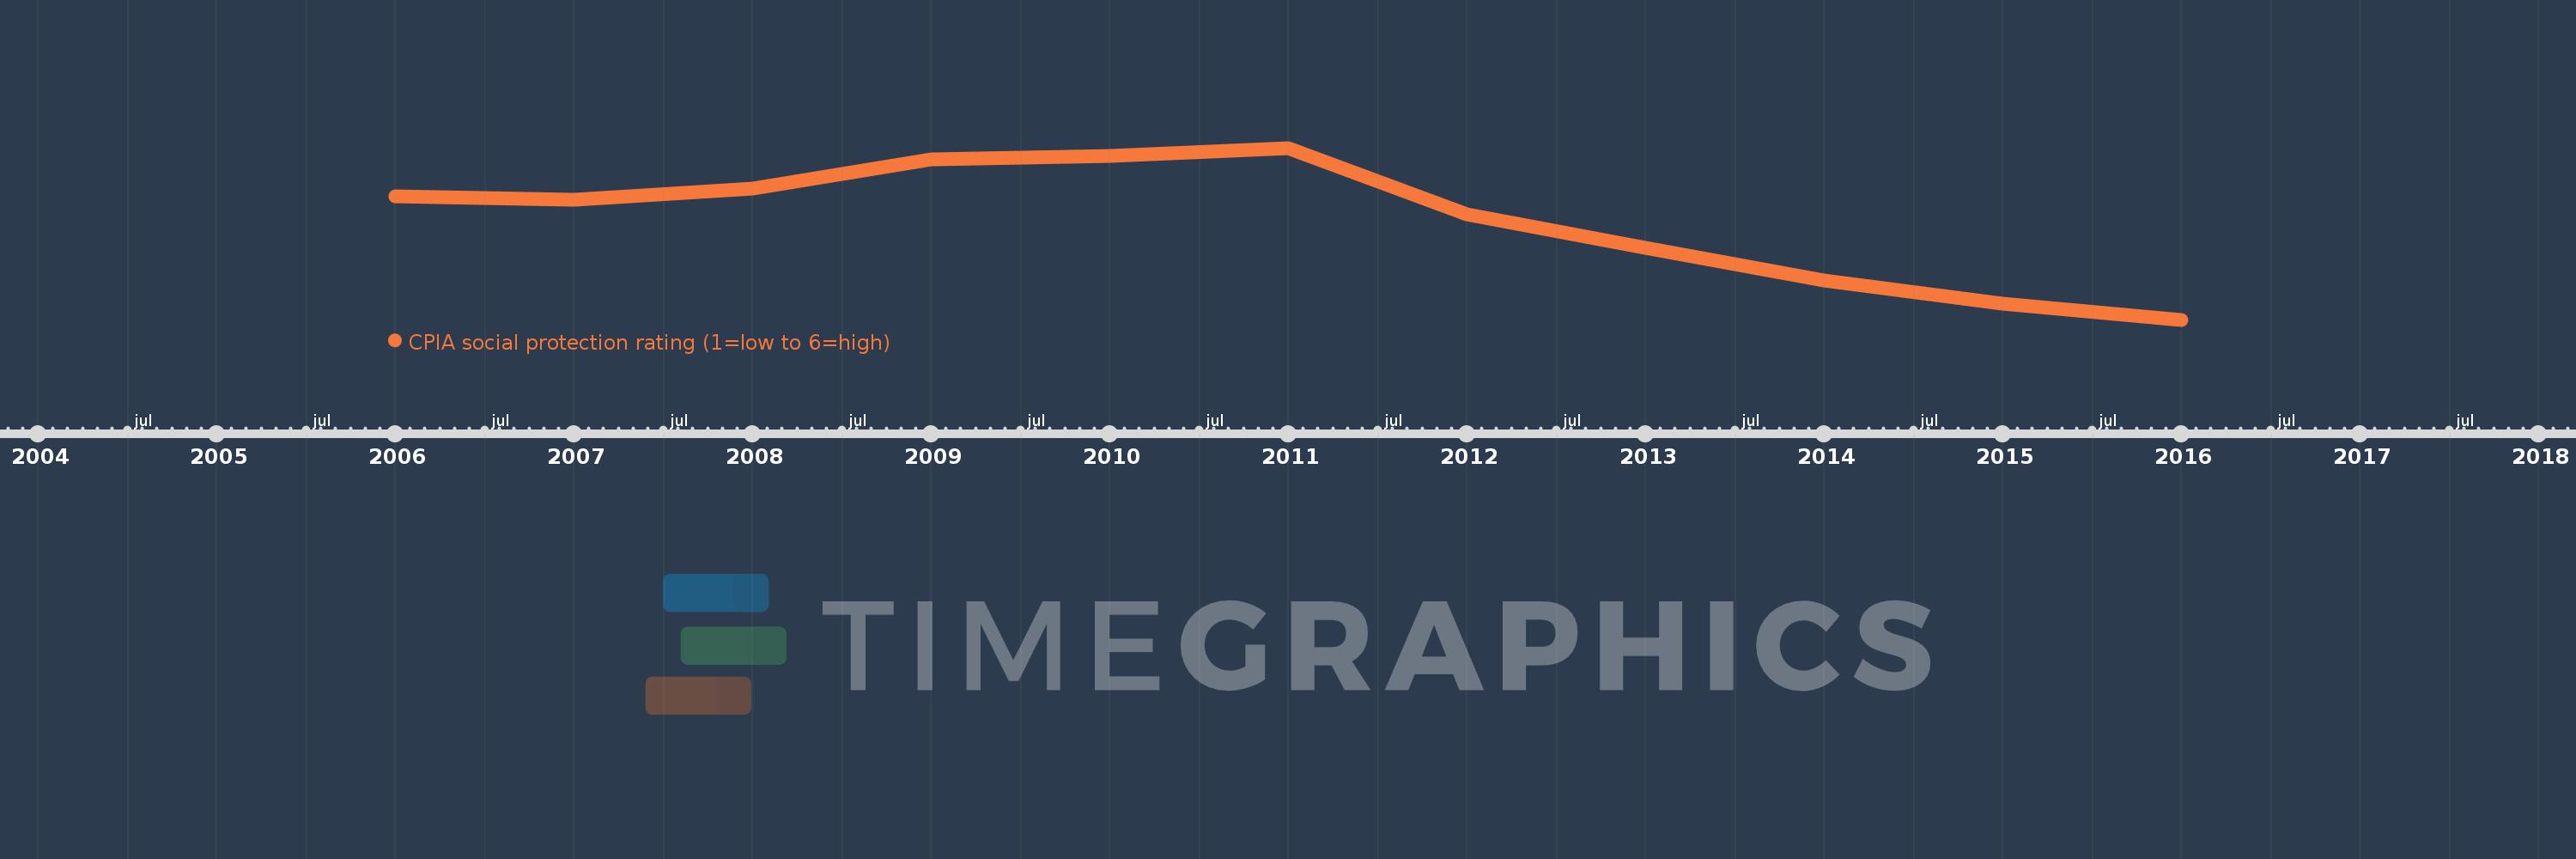
Nesta escala de tempo está apresentado um gráfico de 2006 ano até 2016 ano Middle income. Dados de 2005 ano ausente. O número de observações reais por data: 11.

Fonte (nome):

Indicadores de desenvolvimento mundial

Fonte (organização):

World Bank Group, CPIA database (http://www.worldbank.org/ida).

Categorias:

Public Sector

Foi atualizado:

23 abr 2017 ano

Indicadores de alterações dos valores ao longo dos anos

Em média:
3.194
Mínimo:
3.064
1 jan 2016 ano
Máximo:
3.286
1 jan 2011 ano
Na data de observação
Valor
Mudança absoluta
A alteração em relação ao valor anterior
1 jan 2006 ano
3.223
+3.223
0.0%
1 jan 2007 ano
3.219
-0.005
-0.14%
1 jan 2008 ano
3.234
+0.015
0.48%
1 jan 2009 ano
3.271
+0.037
1.14%
1 jan 2010 ano
3.276
+0.005
0.14%
1 jan 2011 ano
3.286
+0.01
0.31%
1 jan 2012 ano
3.2
-0.086
-2.61%
1 jan 2013 ano
3.157
-0.043
-1.35%
1 jan 2014 ano
3.115
-0.041
-1.31%
1 jan 2015 ano
3.085
-0.03
-0.97%
1 jan 2016 ano
3.064
-0.021
-0.69%

Classificação de países por estatísticas atuais por anos