33
/pt/
AIzaSyB4mHJ5NPEv-XzF7P6NDYXjlkCWaeKw5bc
November 1, 2025
50541
Middle East & North Africa (IDA & IBRD countries)
TMN
false
2
1
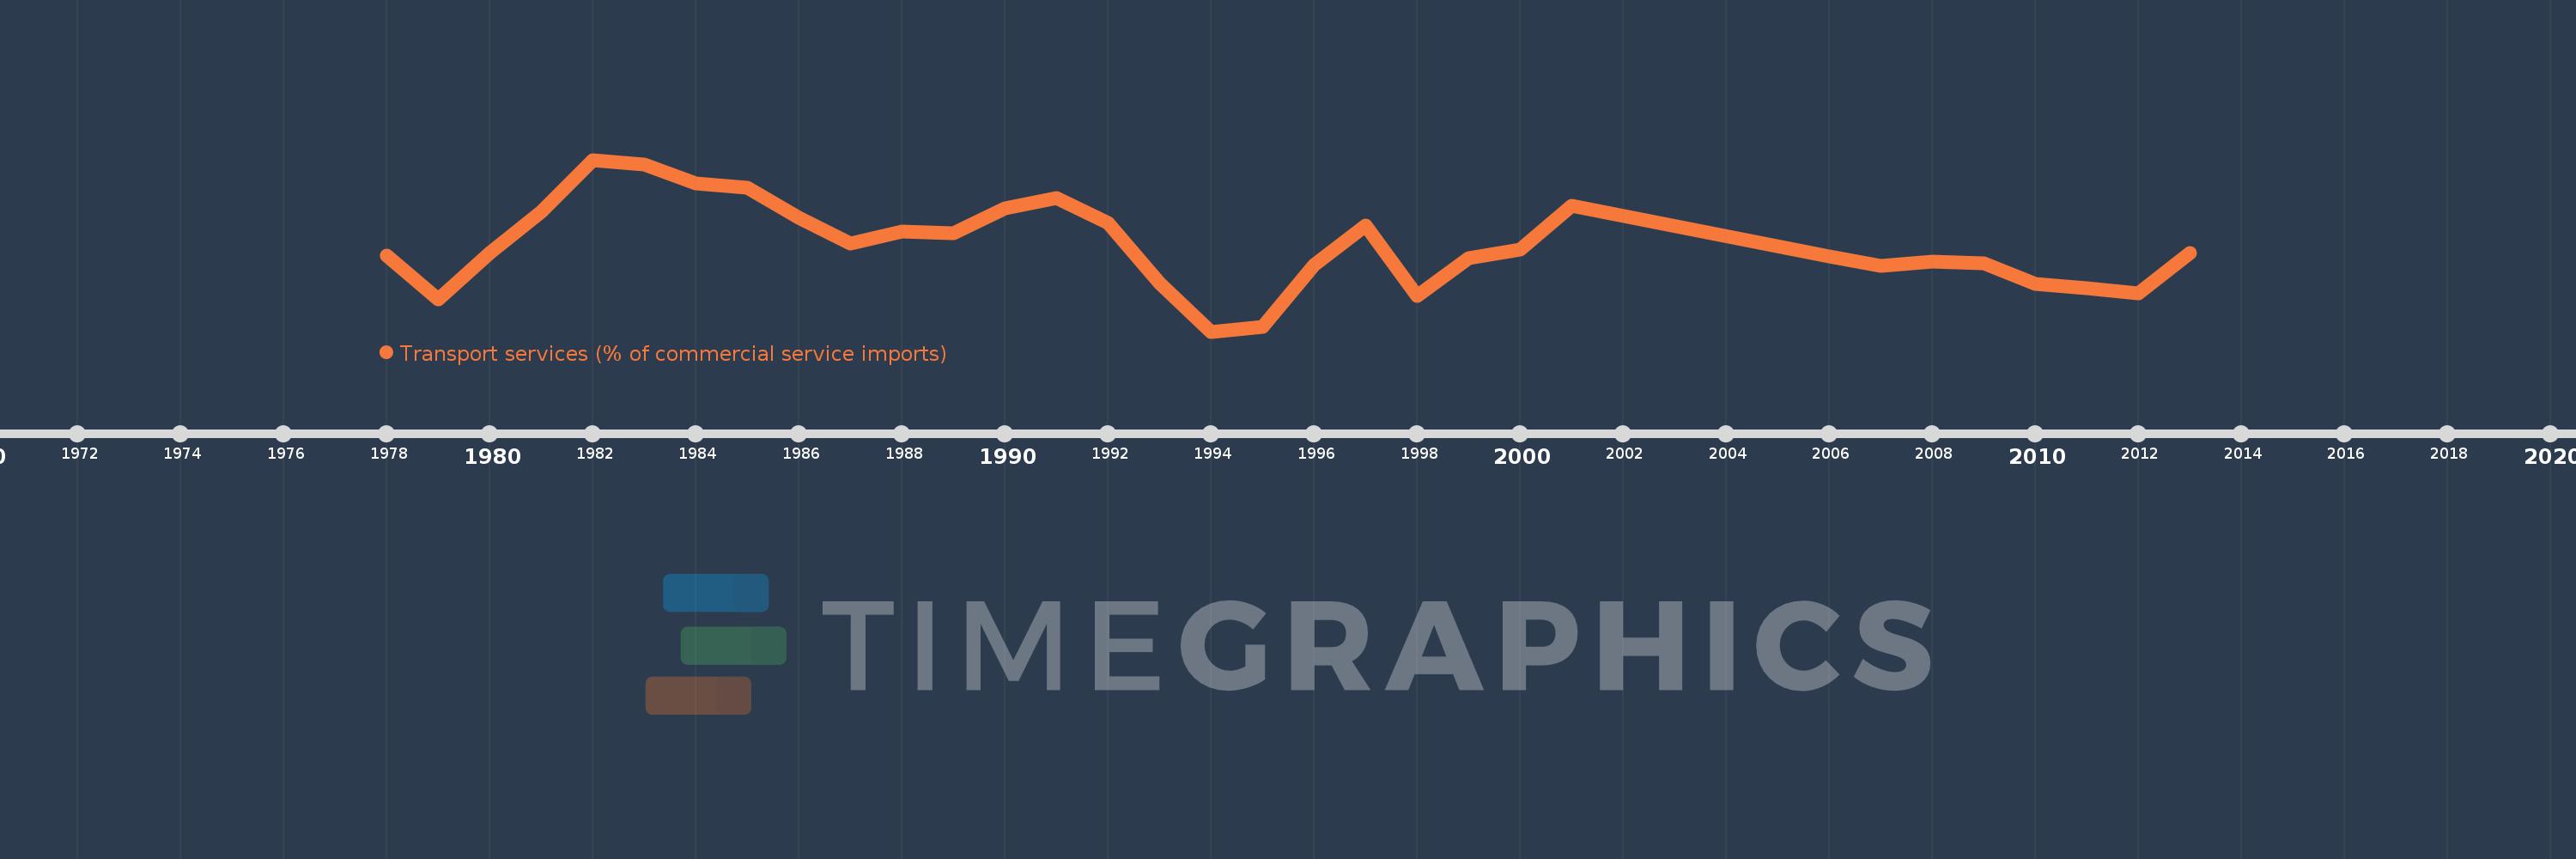
Transport services (% of commercial service imports)
2013,2012,2011,2010,2009,2008,2007,2006,2001,2000,1999,1998,1997,1996,1995,1994,1993,1992,1991,1990,1989,1988,1987,1986,1985,1984,1983,1982,1981,1980,1979,1978