33
/pt/
AIzaSyB4mHJ5NPEv-XzF7P6NDYXjlkCWaeKw5bc
November 1, 2025
48109
Middle East & North Africa
MEA
false
2
1
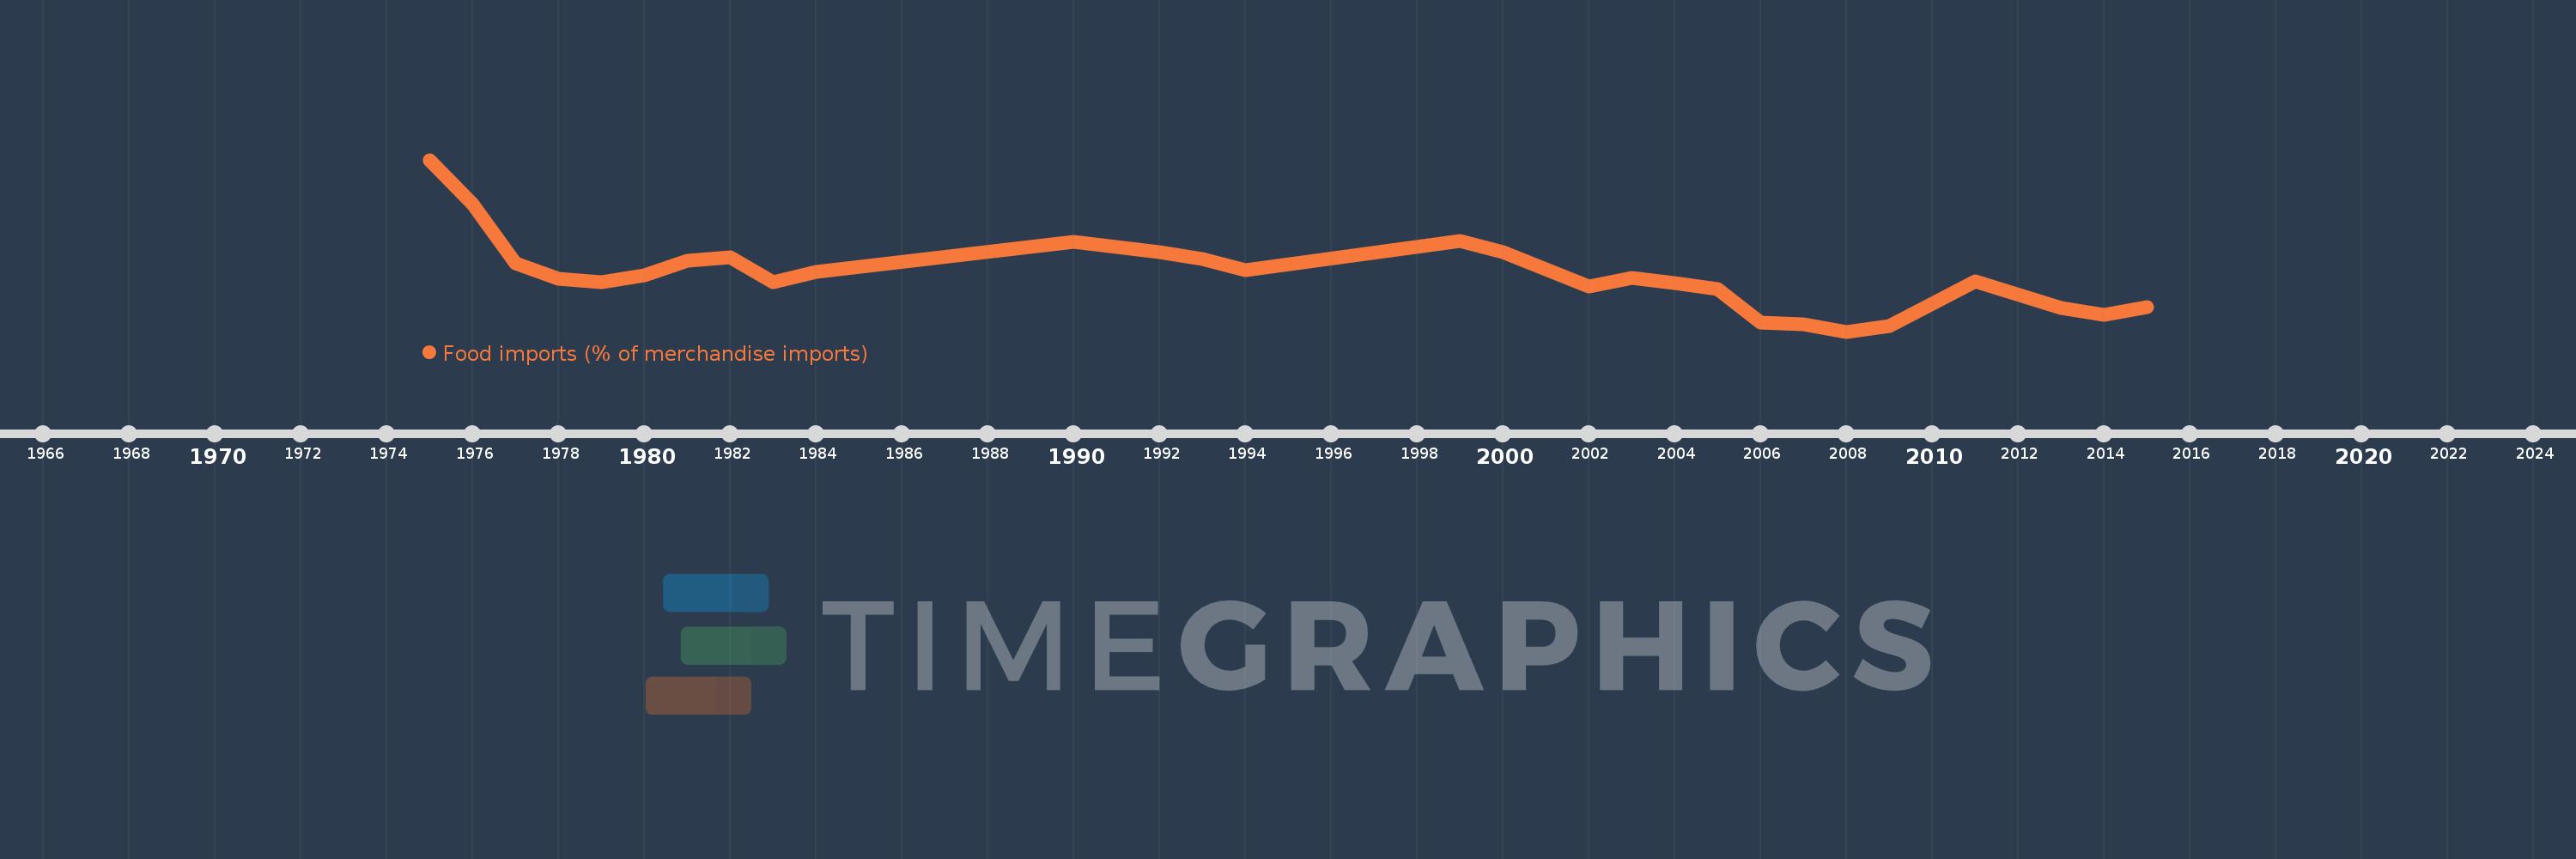
Food imports (% of merchandise imports)
2015,2014,2013,2011,2009,2008,2007,2006,2005,2004,2003,2002,2001,2000,1999,1994,1993,1992,1990,1984,1983,1982,1981,1980,1979,1978,1977,1976,1975