29
/pt/
pt
AIzaSyAYiBZKx7MnpbEhh9jyipgxe19OcubqV5w
April 1, 2024
46691
Low income
LIC
false
2
1
Stocks traded, turnover ratio of domestic shares (%)
2013,2012,2011,2010,2007,2006,2005,2004,2003,2002,2001,2000,1999,1998,1997,1996,1995
Download
Biblioteca de estatísticas globais →Low income →

Stocks traded, turnover ratio of domestic shares (%)

Estas estatísticas em outros países:
Arab WorldArgentinaArmeniaAustraliaAustriaBahrainBangladeshBarbadosBelgiumBermudaBoliviaBotswanaBrazilBulgariaCanadaCaribbean small statesCayman IslandsCentral Europe and the BalticsChannel IslandsChileChinaColombiaCosta RicaCote d'IvoireCroatiaCyprusCzech RepublicDenmarkEarly-demographic dividendEast Asia & PacificEast Asia & Pacific (excluding high income)East Asia & Pacific (IDA & IBRD countries)EcuadorEgypt, Arab Rep.El SalvadorEuro areaEurope & Central AsiaEurope & Central Asia (excluding high income)Europe & Central Asia (IDA & IBRD countries)European UnionFijiFinlandFragile and conflict affected situationsFranceGeorgiaGermanyGhanaGreeceGuyanaHeavily indebted poor countries (HIPC)High incomeHong Kong SAR, ChinaHungaryIBRD onlyIDA & IBRD totalIDA blendIDA onlyIDA totalIndiaIndonesiaIran, Islamic Rep.IrelandIsraelItalyJamaicaJapanJordanKazakhstanKenyaKorea, Rep.KuwaitKyrgyz RepublicLate-demographic dividendLatin America & Caribbean Latin America & Caribbean (excluding high income)Latin America & the Caribbean (IDA & IBRD countries)Least developed countries: UN classificationLebanonLow & middle incomeLow incomeLower middle incomeLuxembourgMacedonia, FYRMalawiMalaysiaMaltaMauritiusMexicoMiddle East & North AfricaMiddle East & North Africa (excluding high income)Middle East & North Africa (IDA & IBRD countries)Middle incomeMoldovaMongoliaMontenegroMoroccoNamibiaNetherlandsNew ZealandNigeriaNorth AmericaNorwayOECD membersOmanOther small statesPacific island small statesPakistanPanamaPapua New GuineaParaguayPeruPhilippinesPolandPortugalPost-demographic dividendPre-demographic dividendQatarRomaniaRussian FederationSaudi ArabiaSerbiaSingaporeSlovak RepublicSloveniaSmall statesSouth AfricaSouth AsiaSouth Asia (IDA & IBRD)SpainSri LankaSt. Kitts and NevisSub-Saharan Africa Sub-Saharan Africa (excluding high income)Sub-Saharan Africa (IDA & IBRD countries)SwazilandSwedenSwitzerlandTanzaniaThailandTrinidad and TobagoTunisiaTurkeyUgandaUkraineUnited Arab EmiratesUnited KingdomUnited StatesUpper middle incomeUruguayUzbekistanVenezuela, RBVietnamWest Bank and GazaWorldZambiaZimbabwe
Linha do tempo:
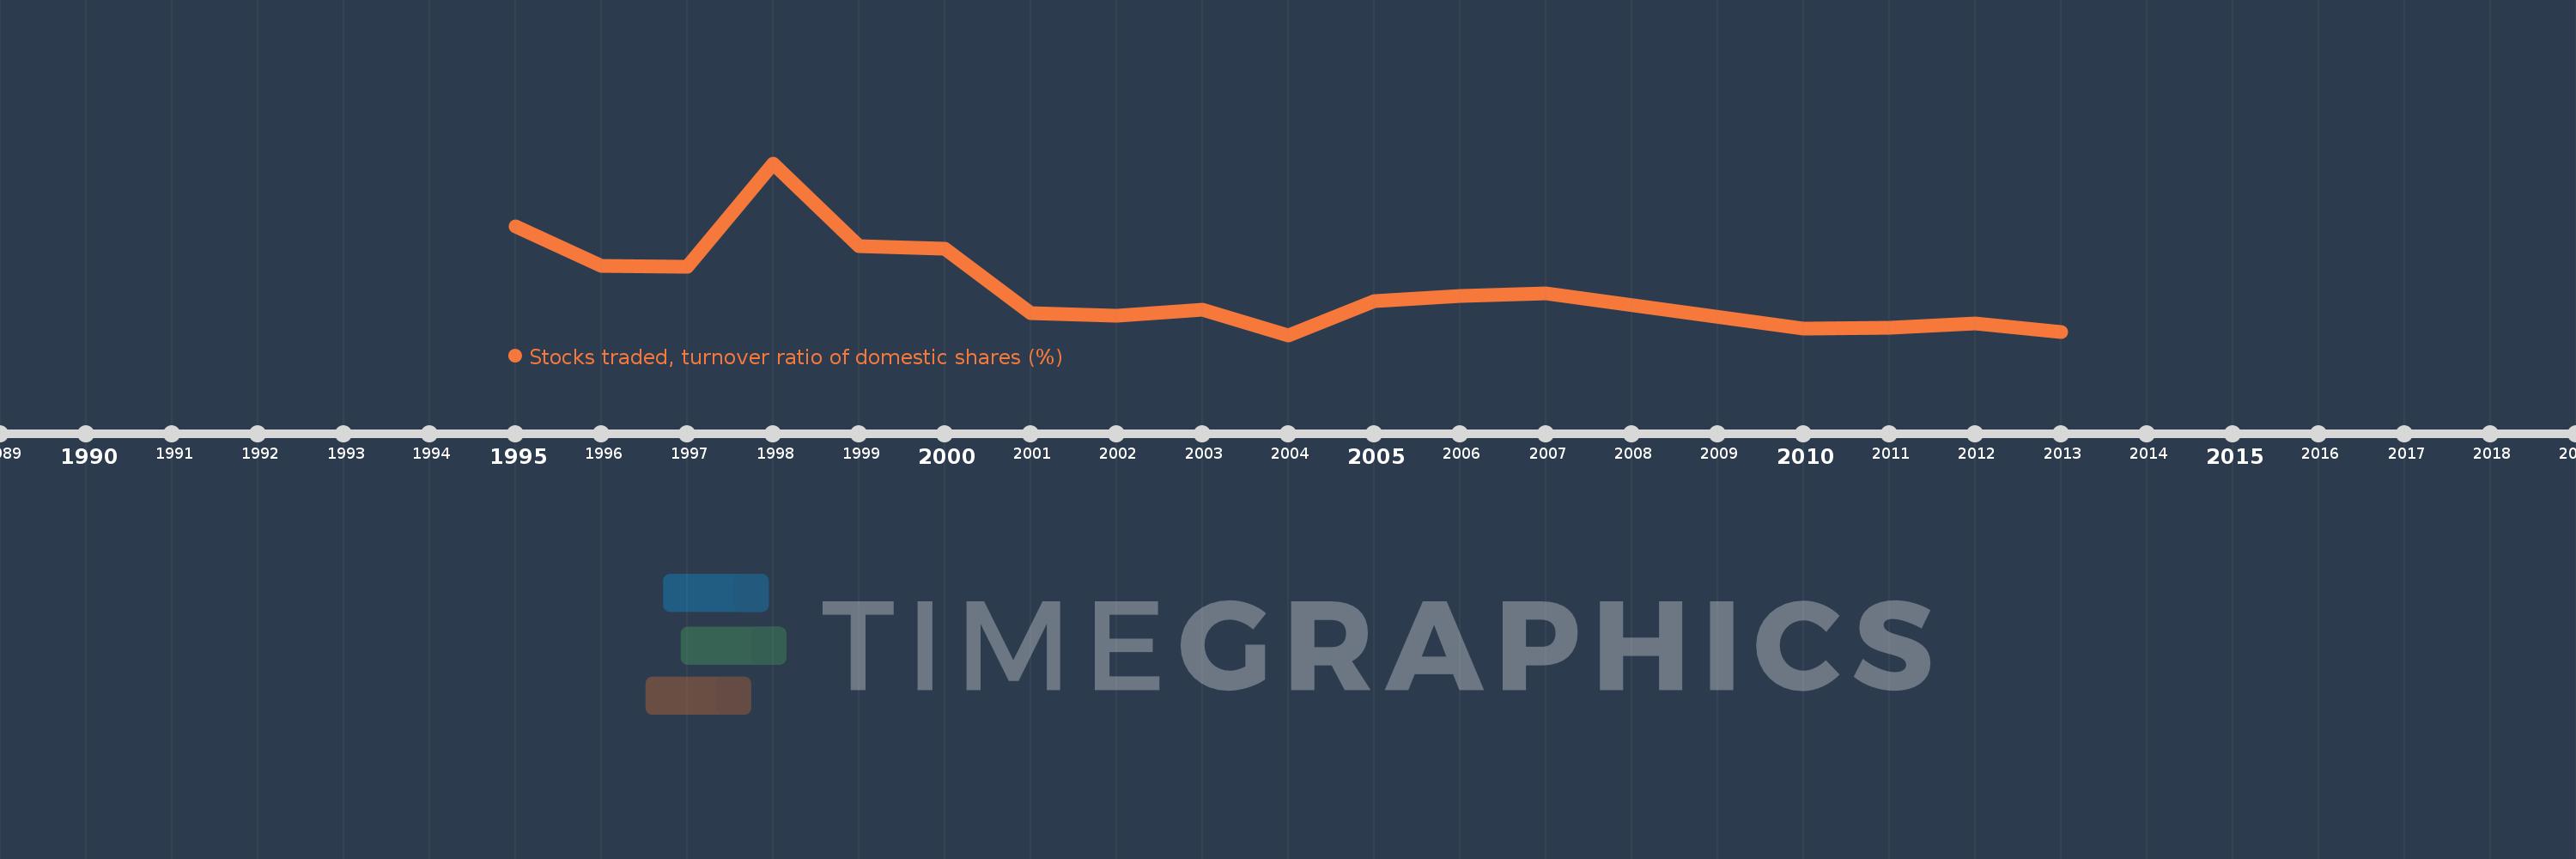
Nesta escala de tempo está apresentado um gráfico de 1995 ano até 2013 ano Low income. Dados de 1994 ano ausente. O número de observações reais por data: 17.
Fonte (nome):
Indicadores de desenvolvimento mundial
Fonte (organização):
World Federation of Exchanges database.
Categorias:
Financial Sector
Foi atualizado:
23 abr 2017 ano
Indicadores de alterações dos valores ao longo dos anos
Em média:
4.464
Mínimo:
0.0
1 jan 2004 ano
Máximo:
16.217
1 jan 1998 ano
Na data de observação
Valor
Mudança absoluta
A alteração em relação ao valor anterior
1 jan 1995 ano
10.261
+10.261
0.0%
1 jan 1996 ano
6.546
-3.714
-36.2%
1 jan 1997 ano
6.444
-0.102
-1.55%
1 jan 1998 ano
16.217
+9.772
151.64%
1 jan 1999 ano
8.395
-7.822
-48.24%
1 jan 2000 ano
8.175
-0.22
-2.62%
1 jan 2001 ano
2.074
-6.101
-74.63%
1 jan 2002 ano
1.791
-0.283
-13.63%
1 jan 2003 ano
2.377
+0.586
32.72%
1 jan 2004 ano
0.0
-2.377
-100.0%
1 jan 2005 ano
3.204
+3.204
%
1 jan 2006 ano
3.727
+0.522
16.3%
1 jan 2007 ano
3.911
+0.185
4.96%
1 jan 2010 ano
0.597
-3.314
-84.74%
1 jan 2011 ano
0.725
+0.128
21.44%
1 jan 2012 ano
1.127
+0.402
55.51%
1 jan 2013 ano
0.32
-0.807
-71.62%
Classificação de países por estatísticas atuais por anos

Comentários:

Enviar
PremiumAbout & FeedbackAcordoPrivacidade
logo
© 2022 Selected Technologies LLC – Morgan Hill, California