29
/pt/
pt
AIzaSyAYiBZKx7MnpbEhh9jyipgxe19OcubqV5w
April 1, 2024
43736
Latin America & the Caribbean (IDA & IBRD countries)
TLA
false
2
1
New business density (new registrations per 1,000 people ages 15-64)
2015,2013,2012,2011,2010,2009,2008,2007,2006,2005
Download
Biblioteca de estatísticas globais →Latin America & the Caribbean (IDA & IBRD countries) →

New business density (new registrations per 1,000 people ages 15-64)

Estas estatísticas em outros países:
AfghanistanAlbaniaAlgeriaAntigua and BarbudaArab WorldArgentinaArmeniaAustraliaAustriaAzerbaijanBangladeshBelarusBelgiumBelizeBhutanBoliviaBosnia and HerzegovinaBotswanaBrazilBritish Virgin IslandsBulgariaBurkina FasoCambodiaCanadaCaribbean small statesCentral Europe and the BalticsChileColombiaCongo, Dem. Rep.Costa RicaCroatiaCyprusCzech RepublicDenmarkDominicaDominican RepublicEarly-demographic dividendEast Asia & PacificEast Asia & Pacific (excluding high income)East Asia & Pacific (IDA & IBRD countries)Egypt, Arab Rep.El SalvadorEstoniaEthiopiaEuro areaEurope & Central AsiaEurope & Central Asia (excluding high income)Europe & Central Asia (IDA & IBRD countries)European UnionFinlandFragile and conflict affected situationsFranceGabonGeorgiaGermanyGhanaGreeceGrenadaGuatemalaGuineaHaitiHeavily indebted poor countries (HIPC)High incomeHong Kong SAR, ChinaHungaryIBRD onlyIcelandIDA & IBRD totalIDA blendIDA onlyIDA totalIndiaIndonesiaIraqIrelandIsle of ManIsraelItalyJamaicaJapanJordanKazakhstanKenyaKiribatiKorea, Rep.KosovoKyrgyz RepublicLao PDRLate-demographic dividendLatin America & Caribbean Latin America & Caribbean (excluding high income)Latin America & the Caribbean (IDA & IBRD countries)LatviaLeast developed countries: UN classificationLesothoLiechtensteinLithuaniaLow & middle incomeLow incomeLower middle incomeLuxembourgMacedonia, FYRMadagascarMalawiMalaysiaMaldivesMaltaMauritiusMexicoMiddle East & North AfricaMiddle East & North Africa (excluding high income)Middle East & North Africa (IDA & IBRD countries)Middle incomeMoldovaMongoliaMontenegroMoroccoNamibiaNepalNetherlandsNew ZealandNigerNigeriaNorth AmericaNorwayOECD membersOmanOther small statesPacific island small statesPakistanPanamaPeruPhilippinesPolandPortugalPost-demographic dividendPre-demographic dividendQatarRomaniaRussian FederationRwandaSamoaSao Tome and PrincipeSenegalSerbiaSierra LeoneSingaporeSlovak RepublicSloveniaSmall statesSouth AfricaSouth AsiaSouth Asia (IDA & IBRD)South SudanSpainSri LankaSt. Kitts and NevisSt. LuciaSt. Vincent and the GrenadinesSub-Saharan Africa Sub-Saharan Africa (excluding high income)Sub-Saharan Africa (IDA & IBRD countries)SurinameSwedenSwitzerlandSyrian Arab RepublicTajikistanThailandTimor-LesteTogoTongaTunisiaTurkeyUgandaUkraineUnited Arab EmiratesUnited KingdomUpper middle incomeUruguayUzbekistanVanuatuWorldZambia
Linha do tempo:
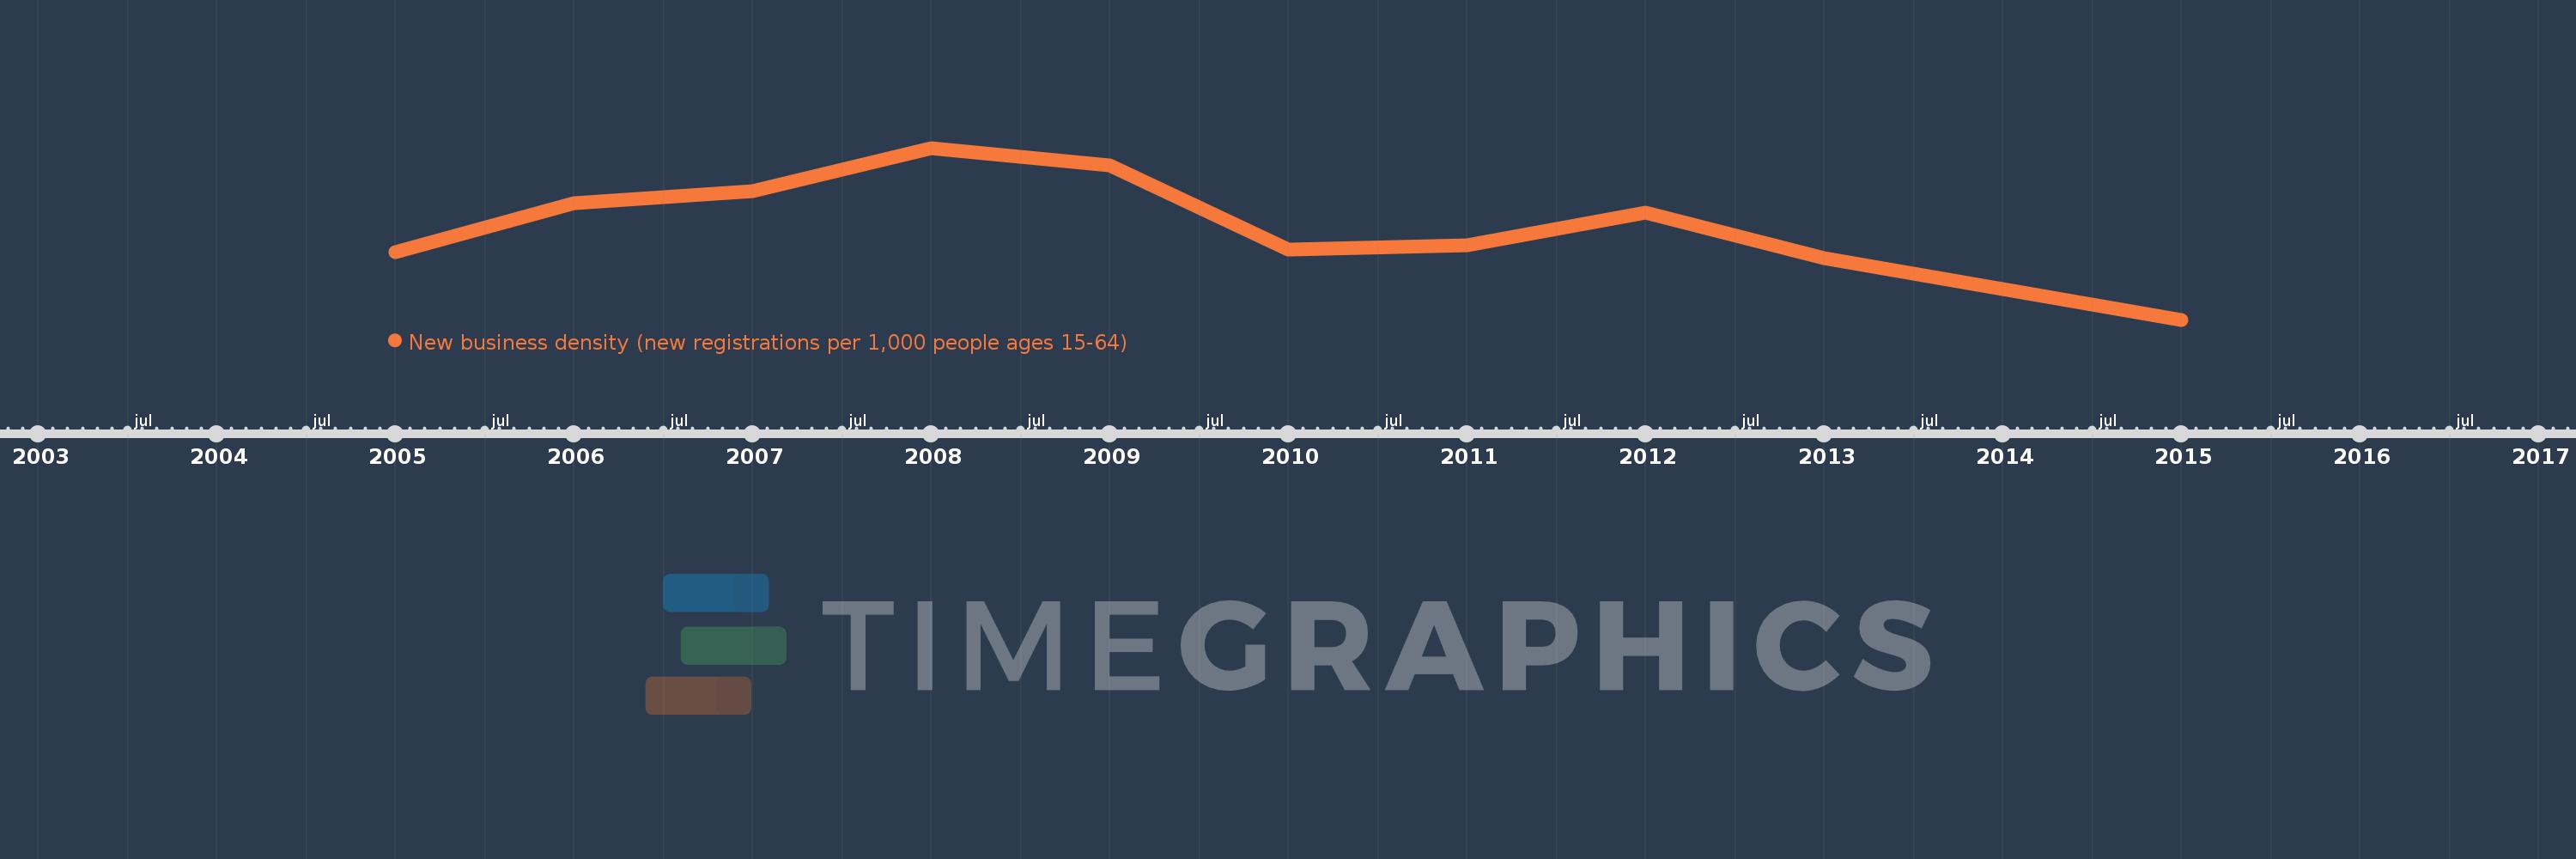
Nesta escala de tempo está apresentado um gráfico de 2005 ano até 2015 ano Latin America & the Caribbean (IDA & IBRD countries). Dados de 2004 ano ausente. O número de observações reais por data: 10.
Fonte (nome):
Indicadores de desenvolvimento mundial
Fonte (organização):
World Bank's Entrepreneurship Survey and database (http://econ.worldbank.org/research/entrepreneurship).
Categorias:
Private Sector
Foi atualizado:
23 abr 2017 ano
Indicadores de alterações dos valores ao longo dos anos
Em média:
2.888
Mínimo:
1.978
1 jan 2015 ano
Máximo:
3.621
1 jan 2008 ano
Na data de observação
Valor
Mudança absoluta
A alteração em relação ao valor anterior
1 jan 2005 ano
2.623
+2.623
0.0%
1 jan 2006 ano
3.089
+0.466
17.76%
1 jan 2007 ano
3.204
+0.116
3.74%
1 jan 2008 ano
3.621
+0.416
12.99%
1 jan 2009 ano
3.452
-0.169
-4.67%
1 jan 2010 ano
2.647
-0.805
-23.33%
1 jan 2011 ano
2.694
+0.048
1.81%
1 jan 2012 ano
2.999
+0.305
11.31%
1 jan 2013 ano
2.57
-0.429
-14.31%
1 jan 2015 ano
1.978
-0.592
-23.03%
Classificação de países por estatísticas atuais por anos

Comentários:

Enviar
PremiumAbout & FeedbackAcordoPrivacidade
logo
© 2022 Selected Technologies LLC – Morgan Hill, California