33
/pt/
AIzaSyB4mHJ5NPEv-XzF7P6NDYXjlkCWaeKw5bc
November 1, 2025
42963
Latin America & Caribbean (excluding high income)
LAC
false
2
1
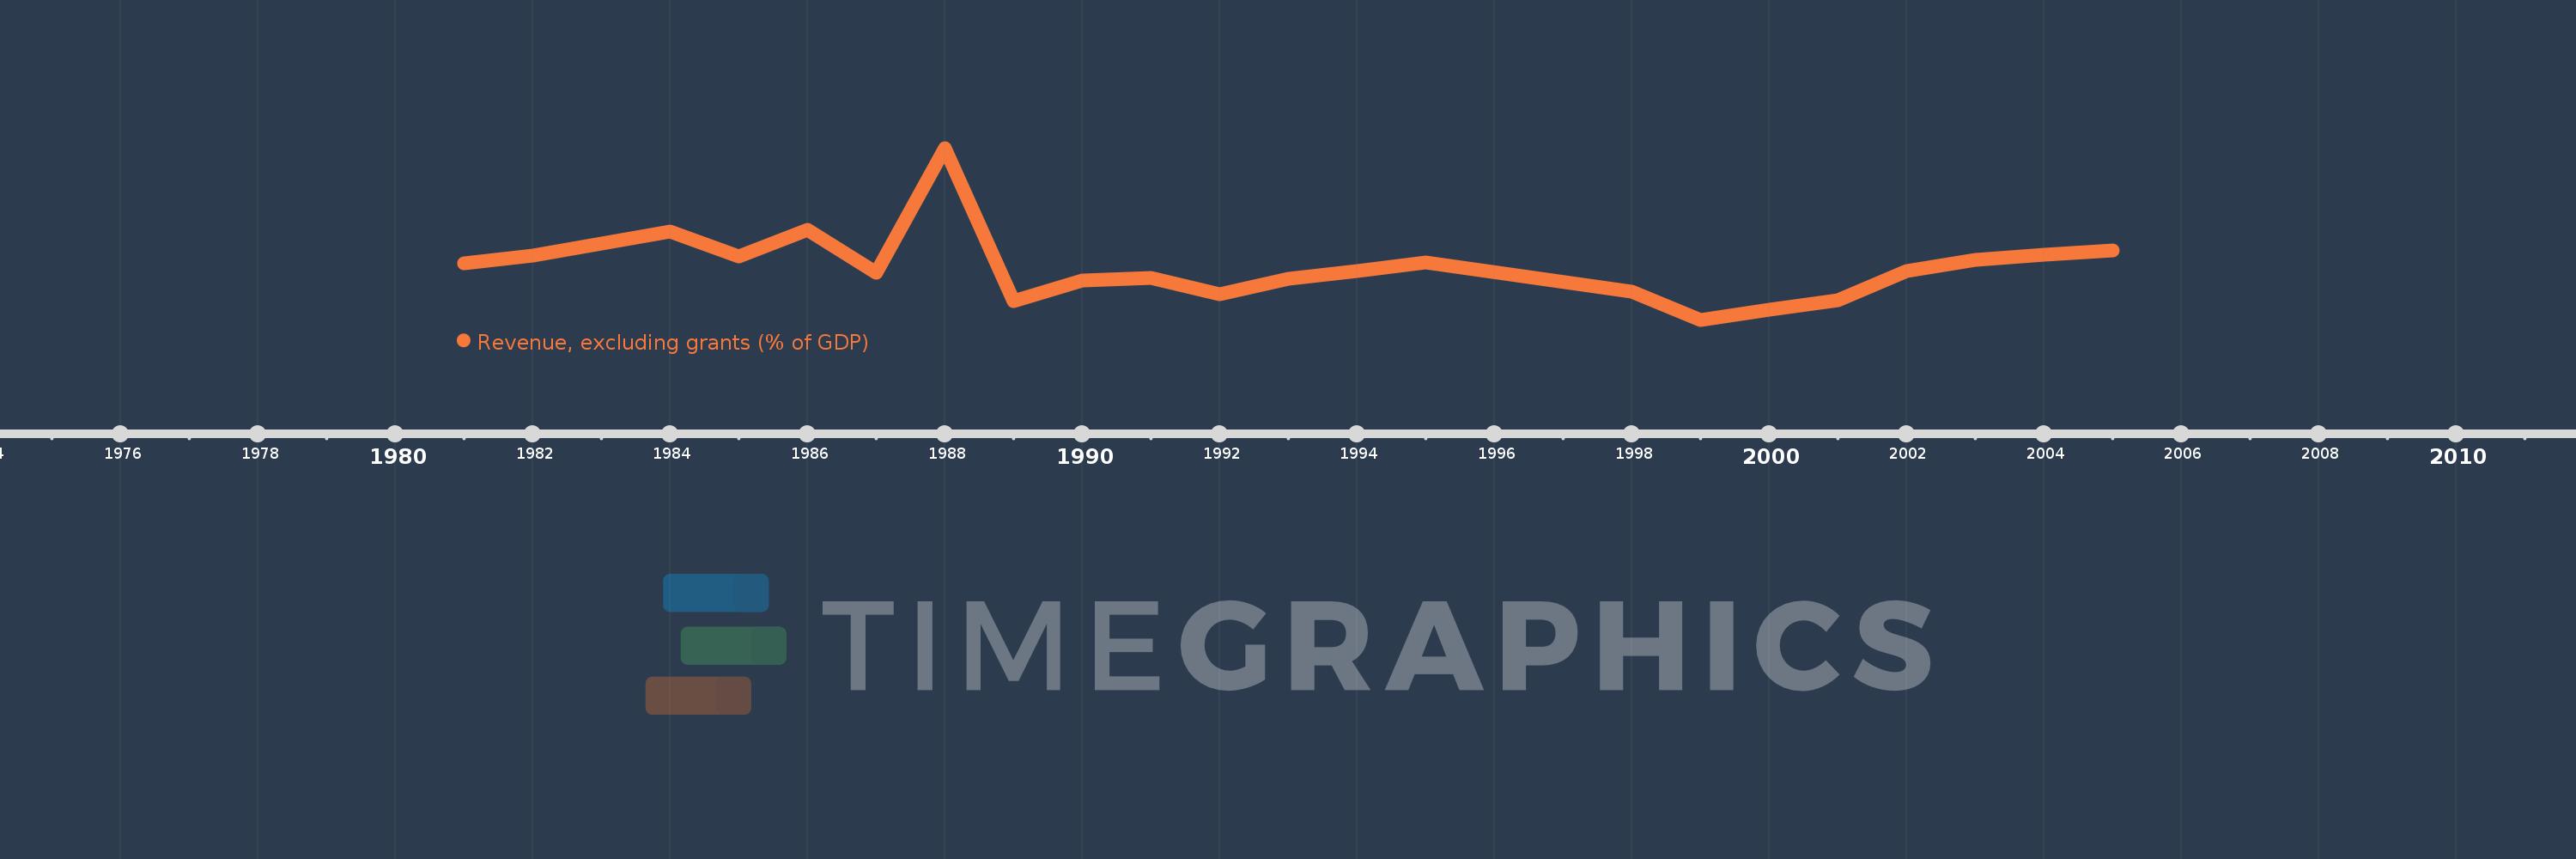
Revenue, excluding grants (% of GDP)
2005,2004,2003,2002,2001,2000,1999,1998,1995,1994,1993,1992,1991,1990,1989,1988,1987,1986,1985,1984,1983,1982,1981