30
/pt/
AIzaSyAYiBZKx7MnpbEhh9jyipgxe19OcubqV5w
April 1, 2024
38746
IDA only
IDX
false
2
1
Antiretroviral therapy coverage (% of people living with HIV)
2016,2015,2014,2013,2012,2011,2010,2009,2008,2007,2006,2005,2004,2003,2002,2001
Download
Biblioteca de estatísticas globais →IDA only →

Antiretroviral therapy coverage (% of people living with HIV)

Estas estatísticas em outros países:

AfghanistanAlgeriaAngolaArab WorldArgentinaArmeniaAustraliaAzerbaijanBahamas, TheBangladeshBarbadosBelarusBelizeBeninBoliviaBotswanaBrazilBurkina FasoBurundiCabo VerdeCambodiaCameroonCaribbean small statesCentral African RepublicChadChileCongo, Dem. Rep.Costa RicaCote d'IvoireCubaDjiboutiDominican RepublicEarly-demographic dividendEcuadorEgypt, Arab Rep.El SalvadorEquatorial GuineaEritreaFragile and conflict affected situationsGabonGambia, TheGeorgiaGhanaGuatemalaGuineaGuyanaHaitiHeavily indebted poor countries (HIPC)HondurasIDA blendIDA onlyIDA totalIndiaIndonesiaIran, Islamic Rep.JamaicaKazakhstanKenyaKyrgyz RepublicLatin America & Caribbean Latin America & Caribbean (excluding high income)Latin America & the Caribbean (IDA & IBRD countries)LatviaLeast developed countries: UN classificationLebanonLesothoLiberiaLow incomeLower middle incomeMadagascarMalawiMalaysiaMaliMauritaniaMauritiusMexicoMiddle East & North AfricaMiddle East & North Africa (excluding high income)Middle East & North Africa (IDA & IBRD countries)MoldovaMongoliaMoroccoMozambiqueMyanmarNamibiaNepalNicaraguaNigerPakistanPanamaPapua New GuineaParaguayPeruPhilippinesPre-demographic dividendRwandaSenegalSierra LeoneSomaliaSouth AfricaSouth AsiaSouth Asia (IDA & IBRD)South SudanSpainSri LankaSub-Saharan Africa Sub-Saharan Africa (excluding high income)Sub-Saharan Africa (IDA & IBRD countries)SudanSurinameSwazilandTajikistanTanzaniaThailandTogoTrinidad and TobagoTunisiaUgandaUkraineUruguayUzbekistanVenezuela, RBVietnamWorldYemen, Rep.ZambiaZimbabwe

Linha do tempo:

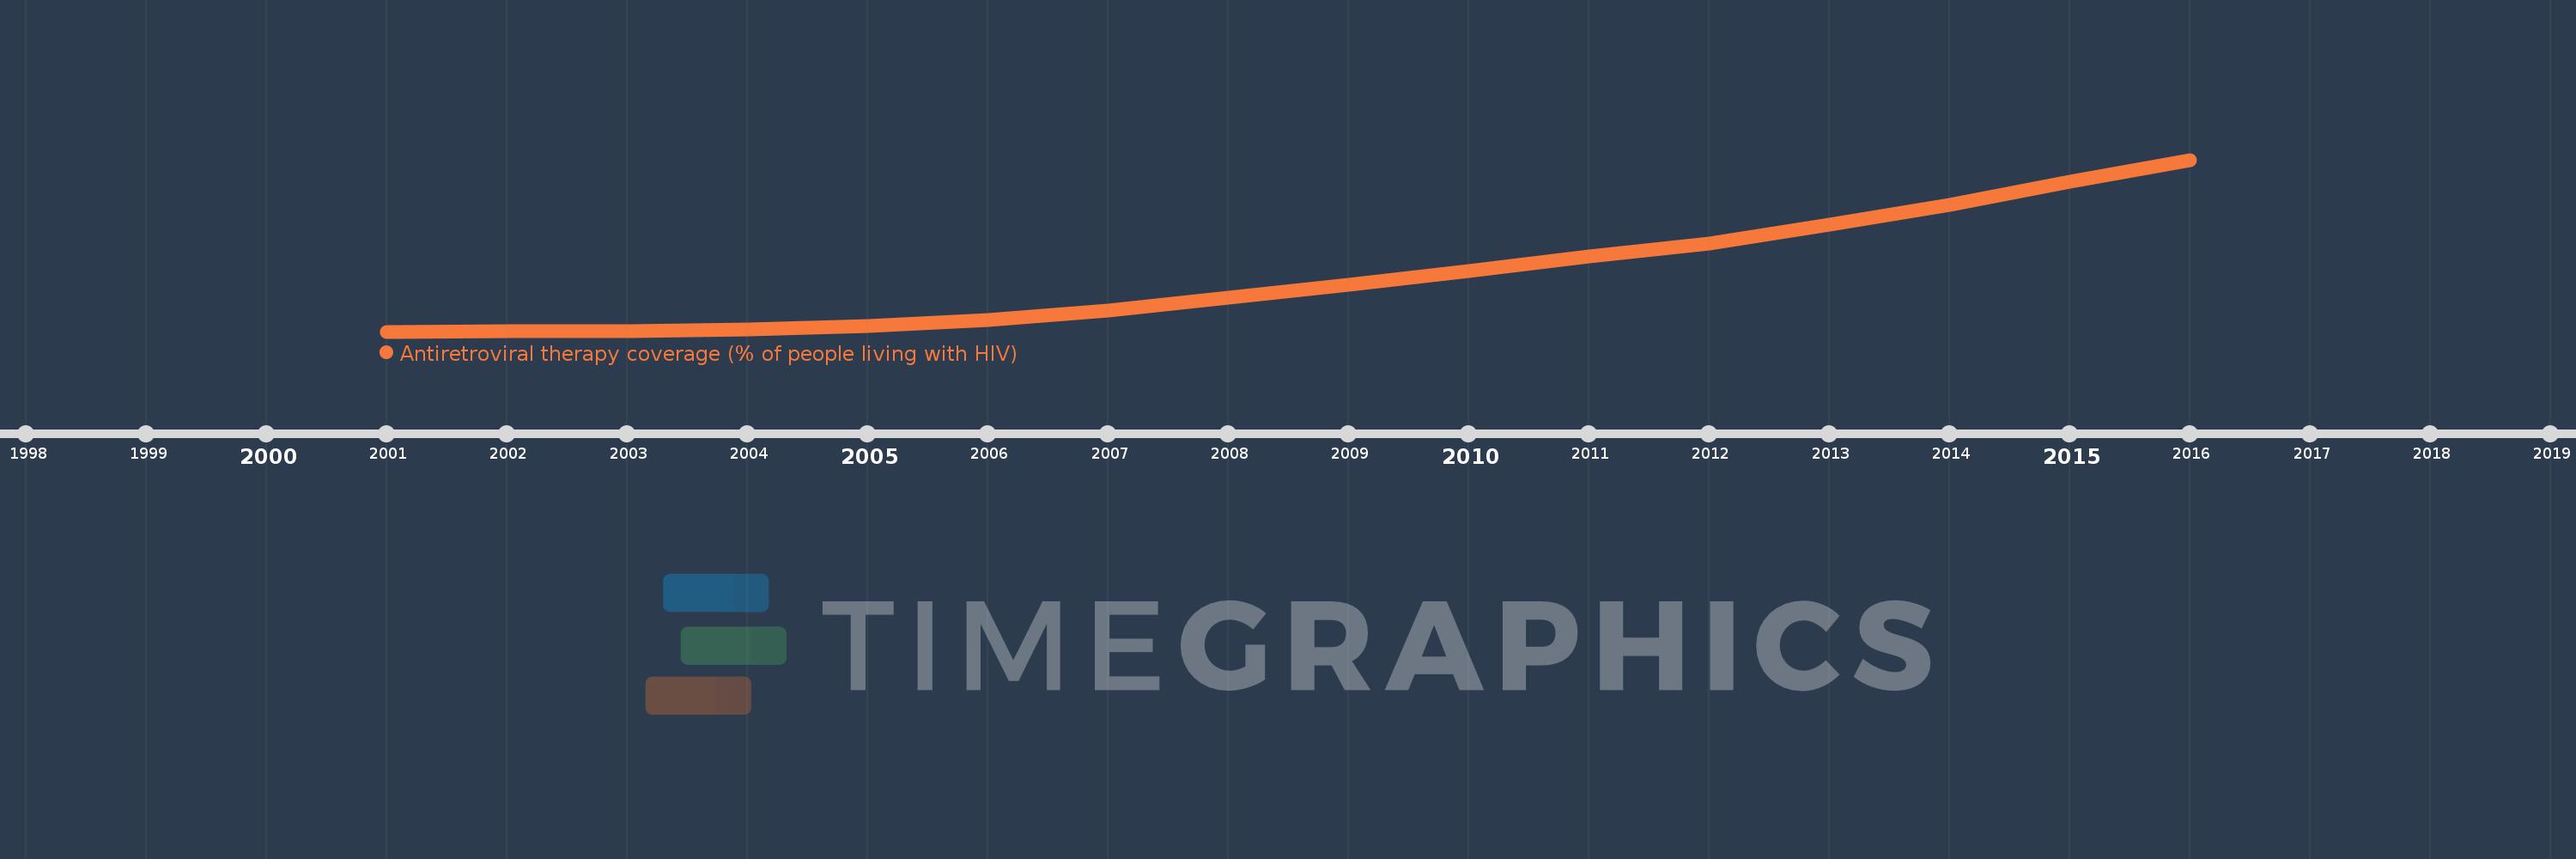
Nesta escala de tempo está apresentado um gráfico de 2001 ano até 2016 ano IDA only. Dados de 2000 ano ausente. O número de observações reais por data: 16.

Fonte (nome):

Indicadores de desenvolvimento mundial

Fonte (organização):

UNAIDS estimates.

Categorias:

Health

Foi atualizado:

23 abr 2017 ano

Indicadores de alterações dos valores ao longo dos anos

Em média:
16.792
Mínimo:
0.0
1 jan 2001 ano
Máximo:
51.309
1 jan 2016 ano
Na data de observação
Valor
Mudança absoluta
A alteração em relação ao valor anterior
1 jan 2001 ano
0.0
0.0
0.0%
1 jan 2002 ano
0.104
+0.104
%
1 jan 2003 ano
0.107
+0.002
2.22%
1 jan 2004 ano
0.516
+0.409
383.49%
1 jan 2005 ano
1.701
+1.185
229.49%
1 jan 2006 ano
3.515
+1.815
106.69%
1 jan 2007 ano
6.193
+2.677
76.17%
1 jan 2008 ano
10.116
+3.923
63.35%
1 jan 2009 ano
13.885
+3.769
37.26%
1 jan 2010 ano
17.976
+4.091
29.46%
1 jan 2011 ano
22.348
+4.373
24.33%
1 jan 2012 ano
26.352
+4.004
17.92%
1 jan 2013 ano
31.816
+5.464
20.73%
1 jan 2014 ano
37.907
+6.091
19.15%
1 jan 2015 ano
44.825
+6.918
18.25%
1 jan 2016 ano
51.309
+6.484
14.47%

Classificação de países por estatísticas atuais por anos