29
/pt/
pt
AIzaSyAYiBZKx7MnpbEhh9jyipgxe19OcubqV5w
April 1, 2024
38716
IDA only
IDX
false
2
1
Adolescents out of school, female (% of female lower secondary school age)
2015,2014,2013,2012,2011,2010,2009,2008,2007,2006,2005,2004,2003,2002,2001,2000,1999
Download
Biblioteca de estatísticas globais →IDA only →

Adolescents out of school, female (% of female lower secondary school age)

Estas estatísticas em outros países:
AfghanistanAlbaniaAlgeriaAngolaAntigua and BarbudaArab WorldArgentinaArmeniaArubaAustraliaAzerbaijanBahamas, TheBahrainBangladeshBarbadosBelarusBelgiumBelizeBeninBermudaBhutanBoliviaBotswanaBrazilBrunei DarussalamBulgariaBurkina FasoBurundiCabo VerdeCambodiaCameroonCanadaCaribbean small statesCentral African RepublicCentral Europe and the BalticsChadChileColombiaComorosCongo, Dem. Rep.Congo, Rep.Costa RicaCroatiaCubaCyprusDenmarkDjiboutiDominicaDominican RepublicEarly-demographic dividendEast Asia & PacificEast Asia & Pacific (excluding high income)East Asia & Pacific (IDA & IBRD countries)EcuadorEgypt, Arab Rep.El SalvadorEritreaEstoniaEthiopiaEuro areaEurope & Central AsiaEurope & Central Asia (excluding high income)Europe & Central Asia (IDA & IBRD countries)European UnionFijiFinlandFragile and conflict affected situationsFranceGambia, TheGeorgiaGhanaGreeceGrenadaGuatemalaGuineaGuinea-BissauGuyanaHeavily indebted poor countries (HIPC)High incomeHondurasHong Kong SAR, ChinaHungaryIBRD onlyIcelandIDA & IBRD totalIDA blendIDA onlyIDA totalIndiaIndonesiaIran, Islamic Rep.IraqIrelandItalyJamaicaJordanKazakhstanKenyaKiribatiKorea, Rep.KuwaitKyrgyz RepublicLao PDRLate-demographic dividendLatin America & Caribbean Latin America & Caribbean (excluding high income)Latin America & the Caribbean (IDA & IBRD countries)LatviaLeast developed countries: UN classificationLebanonLesothoLibyaLiechtensteinLithuaniaLow & middle incomeLow incomeLower middle incomeLuxembourgMacao SAR, ChinaMacedonia, FYRMadagascarMalawiMaldivesMaliMaltaMauritaniaMauritiusMexicoMiddle East & North AfricaMiddle East & North Africa (excluding high income)Middle East & North Africa (IDA & IBRD countries)Middle incomeMoldovaMongoliaMoroccoMozambiqueMyanmarNamibiaNauruNetherlandsNew ZealandNicaraguaNigerNorth AmericaNorwayOECD membersOmanOther small statesPacific island small statesPakistanPanamaParaguayPeruPhilippinesPolandPortugalPost-demographic dividendPre-demographic dividendPuerto RicoQatarRomaniaRussian FederationSamoaSao Tome and PrincipeSaudi ArabiaSenegalSerbiaSeychellesSierra LeoneSloveniaSmall statesSolomon IslandsSomaliaSouth AfricaSouth AsiaSouth Asia (IDA & IBRD)SpainSri LankaSt. Kitts and NevisSt. LuciaSt. Vincent and the GrenadinesSub-Saharan Africa Sub-Saharan Africa (excluding high income)Sub-Saharan Africa (IDA & IBRD countries)SudanSurinameSwazilandSwedenSwitzerlandSyrian Arab RepublicTajikistanThailandTimor-LesteTogoTongaTrinidad and TobagoTunisiaTurkeyTuvaluUgandaUkraineUnited Arab EmiratesUnited KingdomUnited StatesUpper middle incomeUruguayVanuatuVenezuela, RBWest Bank and GazaWorldYemen, Rep.Zimbabwe
Linha do tempo:
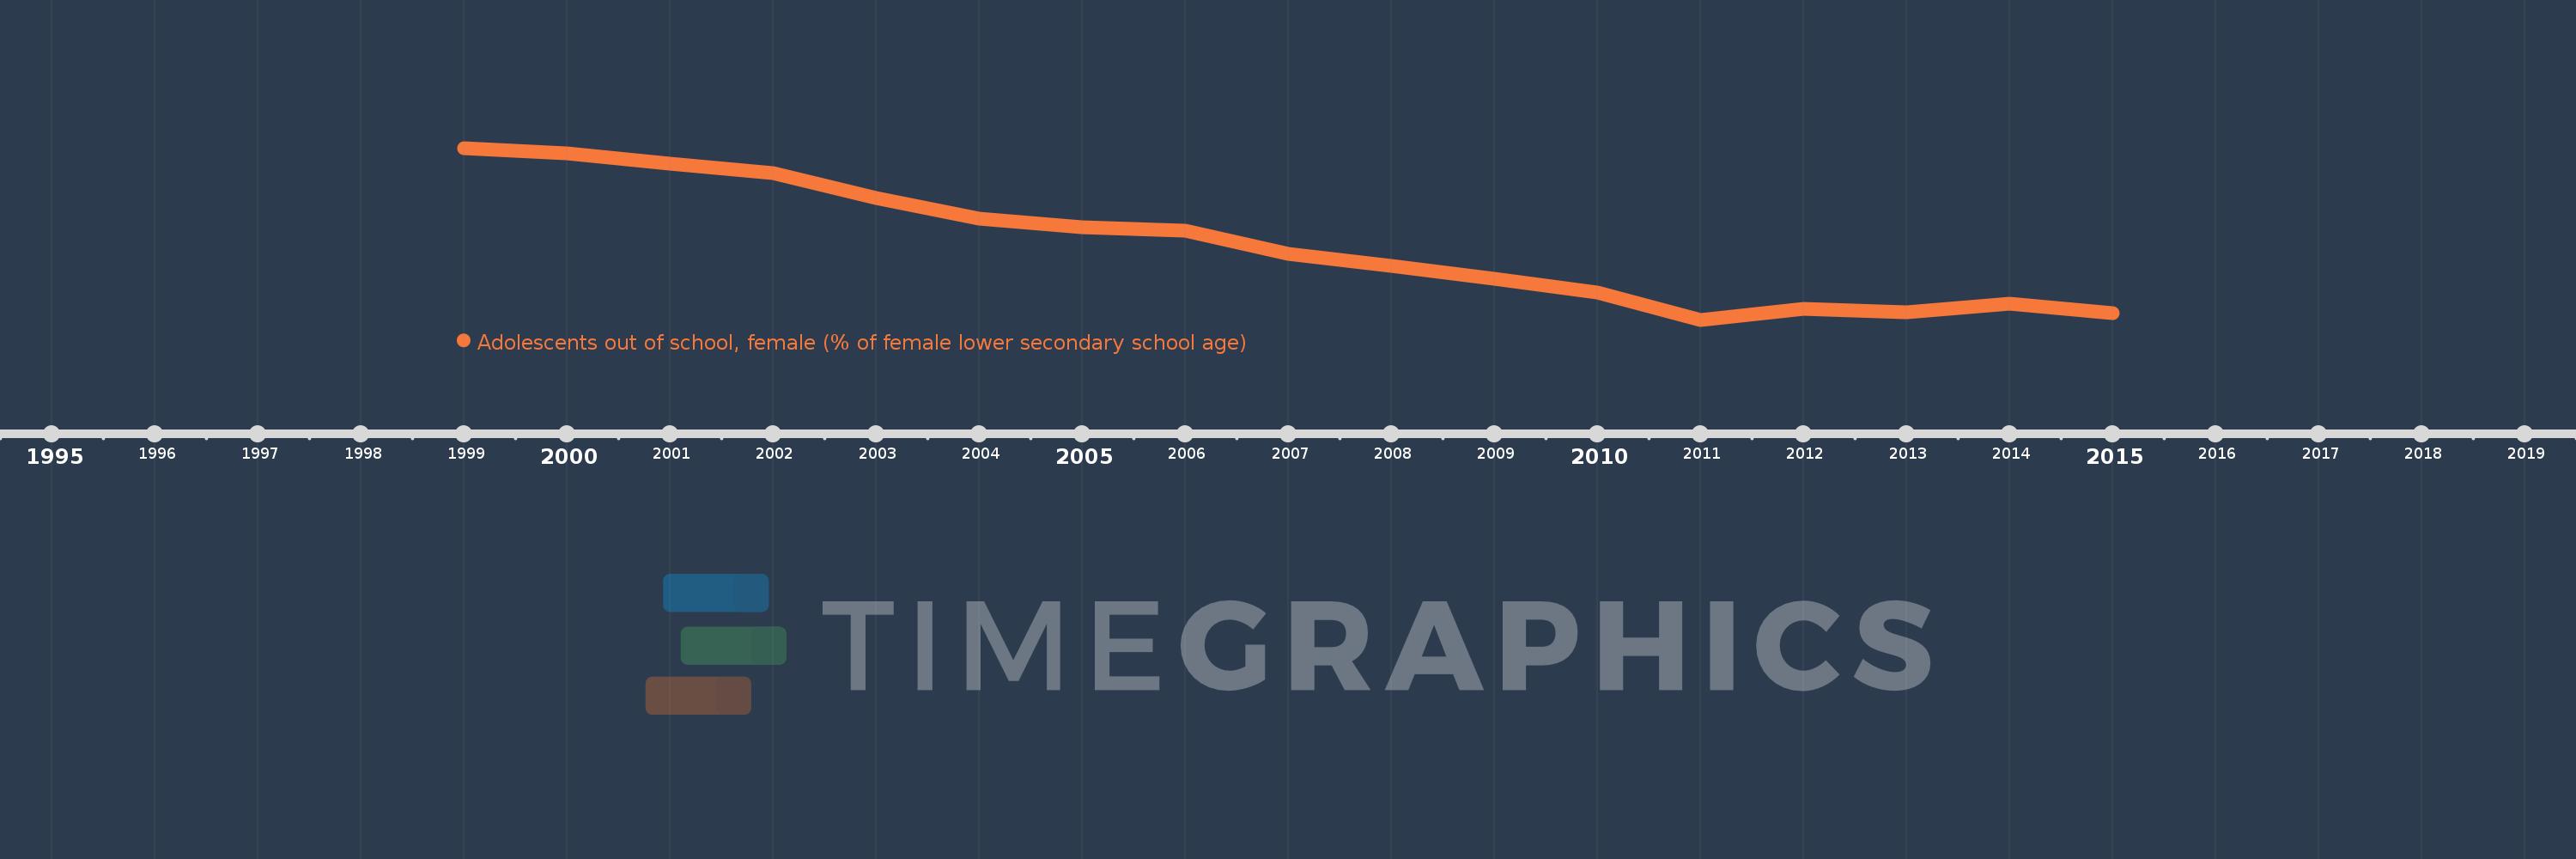
Nesta escala de tempo está apresentado um gráfico de 1999 ano até 2015 ano IDA only. Dados de 1998 ano ausente. O número de observações reais por data: 17.
Fonte (nome):
Indicadores de desenvolvimento mundial
Fonte (organização):
United Nations Educational, Scientific, and Cultural Organization (UNESCO) Institute for Statistics.
Categorias:
Education
Foi atualizado:
23 abr 2017 ano
Indicadores de alterações dos valores ao longo dos anos
Em média:
42.224
Mínimo:
34.34
1 jan 2011 ano
Máximo:
52.39
1 jan 1999 ano
Na data de observação
Valor
Mudança absoluta
A alteração em relação ao valor anterior
1 jan 1999 ano
52.39
+52.39
0.0%
1 jan 2000 ano
51.809
-0.581
-1.11%
1 jan 2001 ano
50.719
-1.09
-2.1%
1 jan 2002 ano
49.767
-0.952
-1.88%
1 jan 2003 ano
47.159
-2.607
-5.24%
1 jan 2004 ano
44.974
-2.185
-4.63%
1 jan 2005 ano
44.103
-0.871
-1.94%
1 jan 2006 ano
43.675
-0.428
-0.97%
1 jan 2007 ano
41.3
-2.375
-5.44%
1 jan 2008 ano
40.023
-1.277
-3.09%
1 jan 2009 ano
38.634
-1.389
-3.47%
1 jan 2010 ano
37.16
-1.474
-3.81%
1 jan 2011 ano
34.34
-2.82
-7.59%
1 jan 2012 ano
35.489
+1.149
3.35%
1 jan 2013 ano
35.17
-0.319
-0.9%
1 jan 2014 ano
36.054
+0.885
2.52%
1 jan 2015 ano
35.042
-1.012
-2.81%
Classificação de países por estatísticas atuais por anos

Comentários:

Enviar
PremiumAbout & FeedbackAcordoPrivacidade
logo
© 2022 Selected Technologies LLC – Morgan Hill, California